Plot cell-level dimensionality reduction.
Usage
plotPca(object, ...)

plotReducedDim(object, ...)

plotTsne(object, ...)

plotUmap(object, ...)

# S4 method for class 'SingleCellExperiment'
plotReducedDim(
  object,
  reduction = "UMAP",
  dims = 1:2,
  interestingGroups = NULL,
  color = getOption(x = "acid.discrete.color", default =
    AcidPlots::acid_scale_color_synesthesia_d()),
  pointSize = getOption(x = "acid.point.size", default = 1L),
  pointAlpha = getOption(x = "acid.point.alpha", default = 0.9),
  pointsAsNumbers = getOption(x = "acid.points.as.numbers", default = FALSE),
  label = getOption(x = "acid.label", default = FALSE),
  labelSize = getOption(x = "acid.label.size", default = 6L),
  dark = getOption(x = "acid.dark", default = FALSE),
  legend = getOption(x = "acid.legend", default = TRUE),
  labels = list(title = NULL, subtitle = NULL)
)

# S4 method for class 'SingleCellExperiment'
plotPca(object, ...)

# S4 method for class 'SummarizedExperiment'
plotPca(
  object,
  assay = 1L,
  interestingGroups = NULL,
  ntop = 500L,
  label = getOption(x = "acid.label", default = FALSE),
  pointSize = getOption(x = "acid.point.size", default = 3L),
  labels = list(title = "PCA", subtitle = NULL)
)

# S4 method for class 'SingleCellExperiment'
plotTsne(object, ...)

# S4 method for class 'SingleCellExperiment'
plotUmap(object, ...)
Arguments
- object
Object.
- reduction
vector(1). Dimension reduction name or index position.- dims
integer. Vector of length 2 that denotes the columns from the reduced dimension matrix to use forcenterXandcenterYcolumn calculations. Defaults the first and second dimensions.- interestingGroups
character. Groups of interest to use for visualization. Corresponds to factors describing the columns of the object.- color
ScaleDiscrete. Desired ggplot2 color scale. Must supply discrete values. When setNULL, the default ggplot2 color palette will be used. If manual color definitions are desired, we recommend usingggplot2::scale_color_manual().To set the discrete color palette globally, use:
- pointSize
numeric(1). Point size for dots in the plot. In the range of 1-3 is generally recommended.- pointAlpha
numeric(1)(0-1). Alpha transparency level.- pointsAsNumbers
logical(1). Plot the points as numbers (TRUE) or dots (FALSE).- label
logical(1). Superimpose sample text labels on the plot.- labelSize
integer(1). Size of the text label.- dark
logical(1). Plot against a dark background using theacid_theme_light()ggplot2 theme.- legend
logical(1). Include plot legend.- labels
list. ggplot2 labels. Seeggplot2::labs()for details.- ...
Additional arguments.
- assay
vector(1). Assay name or index position.- ntop
integer(1)orInf. Number of most variable genes to plot. UseInfto include all genes (not recommended).
Reduction types
PCA: Principal Component Analysis.
t-SNE: t-distributed Stochastic Neighbor Embedding.
UMAP: Uniform Manifold Approximation and Projection.
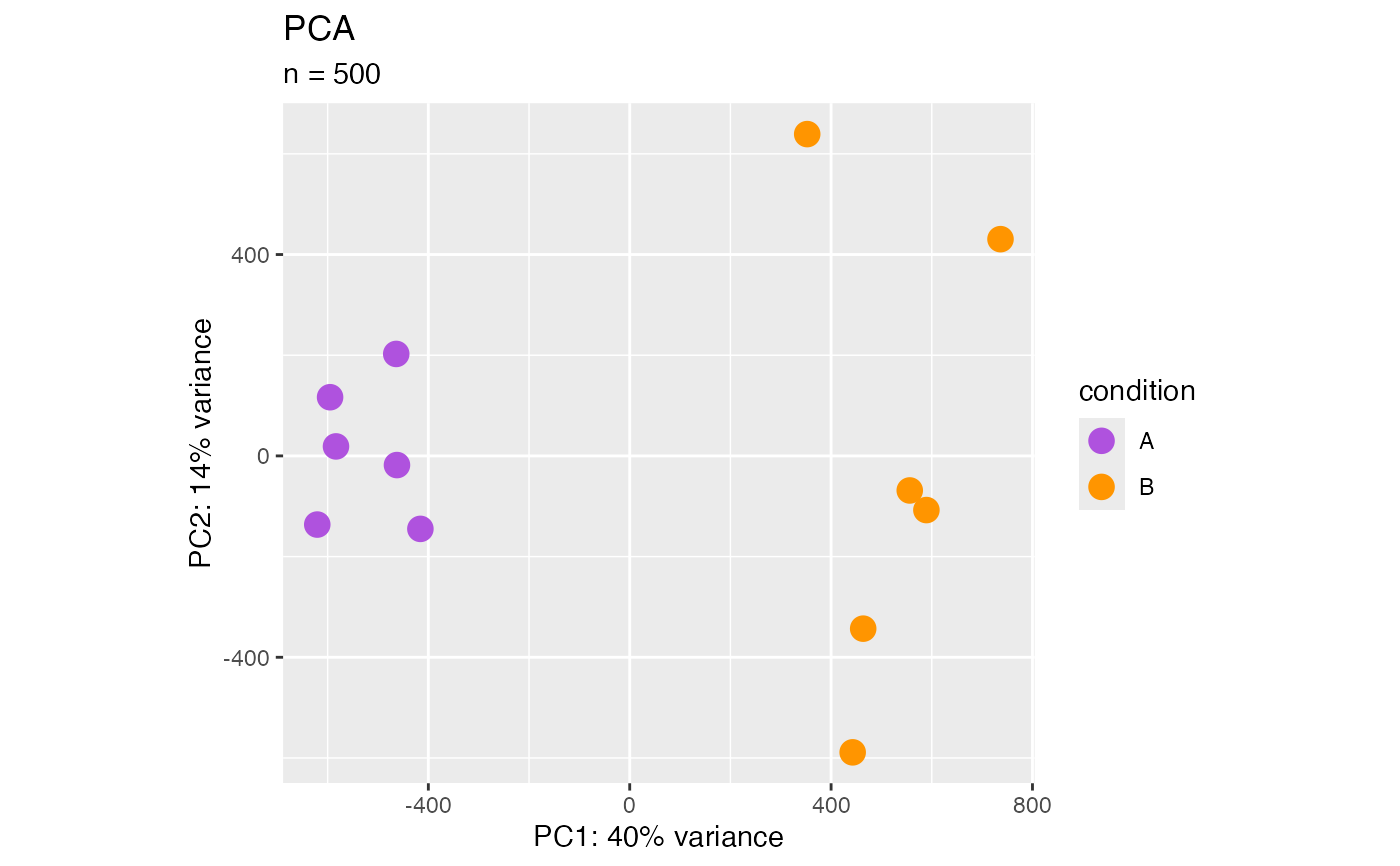
Principal component analysis (plotPca)
PCA (Jolliffe, et al., 2002) is a multivariate technique that allows us to summarize the systematic patterns of variations in the data. PCA takes the expression levels for genes and transforms it in principal component space, reducing each sample into one point. Thereby, we can separate samples by expression variation, and identify potential sample outliers. The PCA plot is a way to look at how samples are clustering.
We're using a modified version of the DESeqTransform method here.
UMAP calculation
UMAP calculation in R requires the Python module umap-learn.
The UMAP module can be loaded in R using reticulate.
Examples
data(
RangedSummarizedExperiment,
SingleCellExperiment_Seurat,
package = "AcidTest"
)
## SummarizedExperiment ====
object <- RangedSummarizedExperiment
plotPca(object)
 ## SingleCellExperiment ====
object <- SingleCellExperiment_Seurat
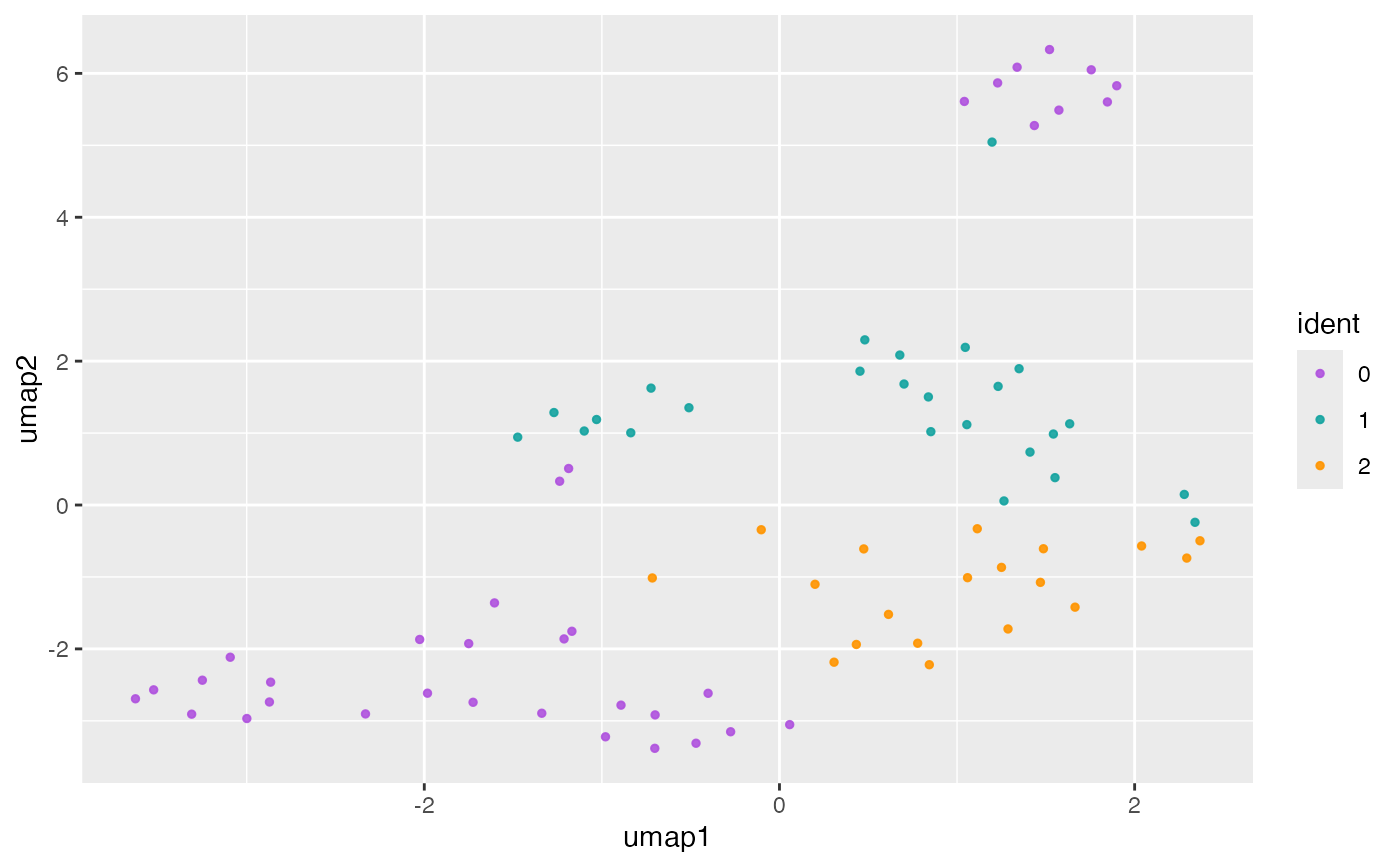
plotReducedDim(object, reduction = "UMAP")
#> reduction: UMAP
#> dims: 1:2
## SingleCellExperiment ====
object <- SingleCellExperiment_Seurat
plotReducedDim(object, reduction = "UMAP")
#> reduction: UMAP
#> dims: 1:2