Complete ggplot2 themes.
Usage
acid_theme_light(
  base_size = 14L,
  base_family = "",
  face = c("bold", "plain"),
  aspect_ratio = NULL,
  legend_position = c("right", "bottom", "top", "none"),
  grid = FALSE,
  minimal = FALSE
)

acid_theme_dark(
  base_size = 14L,
  base_family = "",
  face = c("bold", "plain"),
  aspect_ratio = NULL,
  legend_position = c("right", "bottom", "top", "none"),
  grid = FALSE,
  minimal = FALSE
)

acid_theme_dracula(
  base_size = 14L,
  base_family = "",
  face = c("bold", "plain"),
  aspect_ratio = NULL,
  legend_position = c("right", "bottom", "top", "none"),
  grid = FALSE,
  minimal = FALSE
)
Arguments
- base_size
numeric(1). Base font size.- base_family
character(1). Base font family.- face
character(1). Font face ("bold","plain").- aspect_ratio
numeric(1). Aspect ratio, specifying the plot proportions. Use1for a perfectly square plot (including the axis labels).- legend_position
character(1). Legend key position. We're being a little more restrictive here, only allowing"bottom","right", or"none". Including the legend at the top or the left side of the plot rarely makes sense and is discouraged.- grid
logical(1). Label the major panel grids.- minimal
logical(1). Remove all axis lines, axis ticks, and panel borders.
Details
Themes are based off of ggplot2::theme_linedraw(), but with modifications
and extra user-definable parameters.
Functions
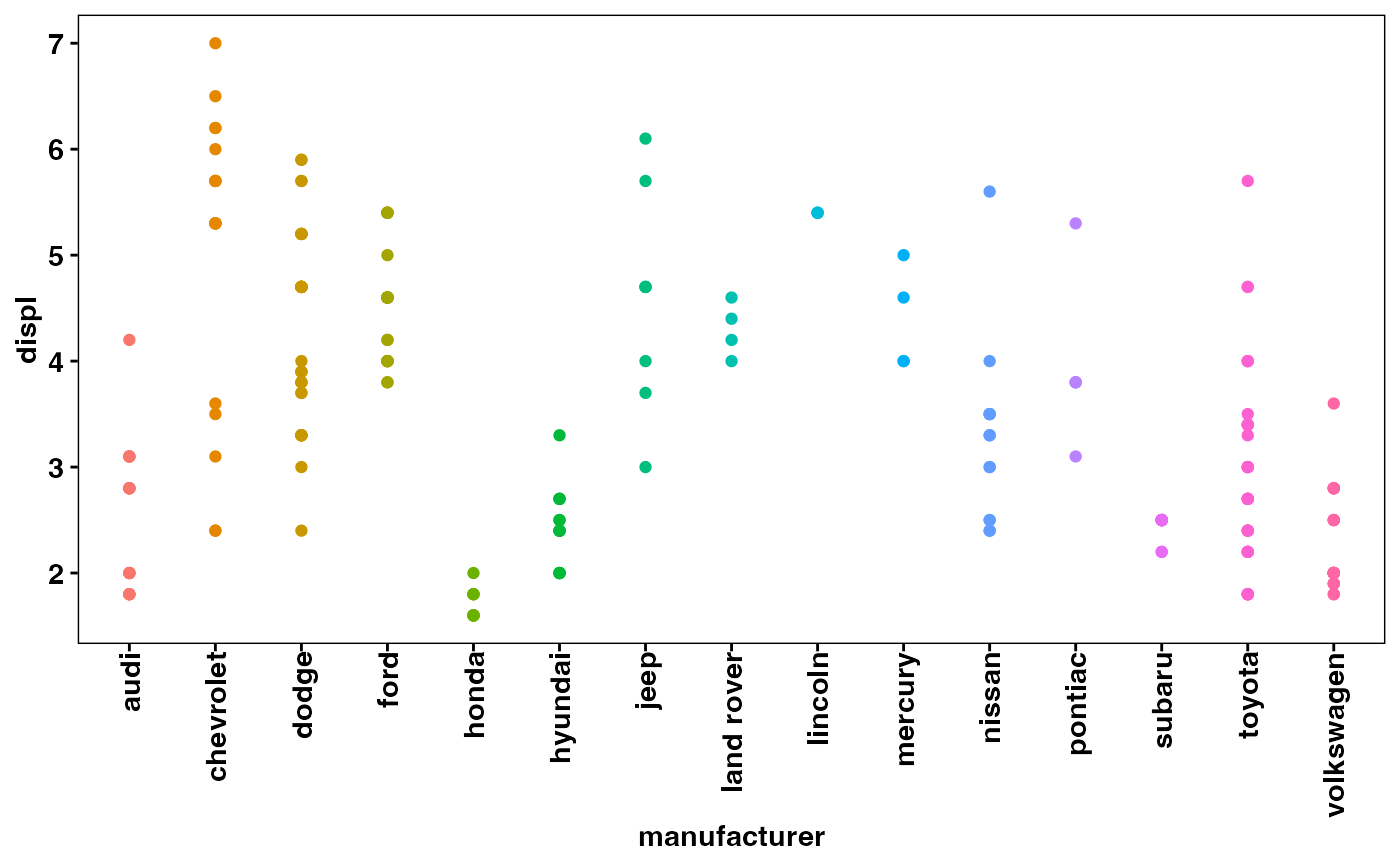
acid_theme_light(): Light theme that has a white background and black text.
Optimized for print and recommended for scientific manuscripts.
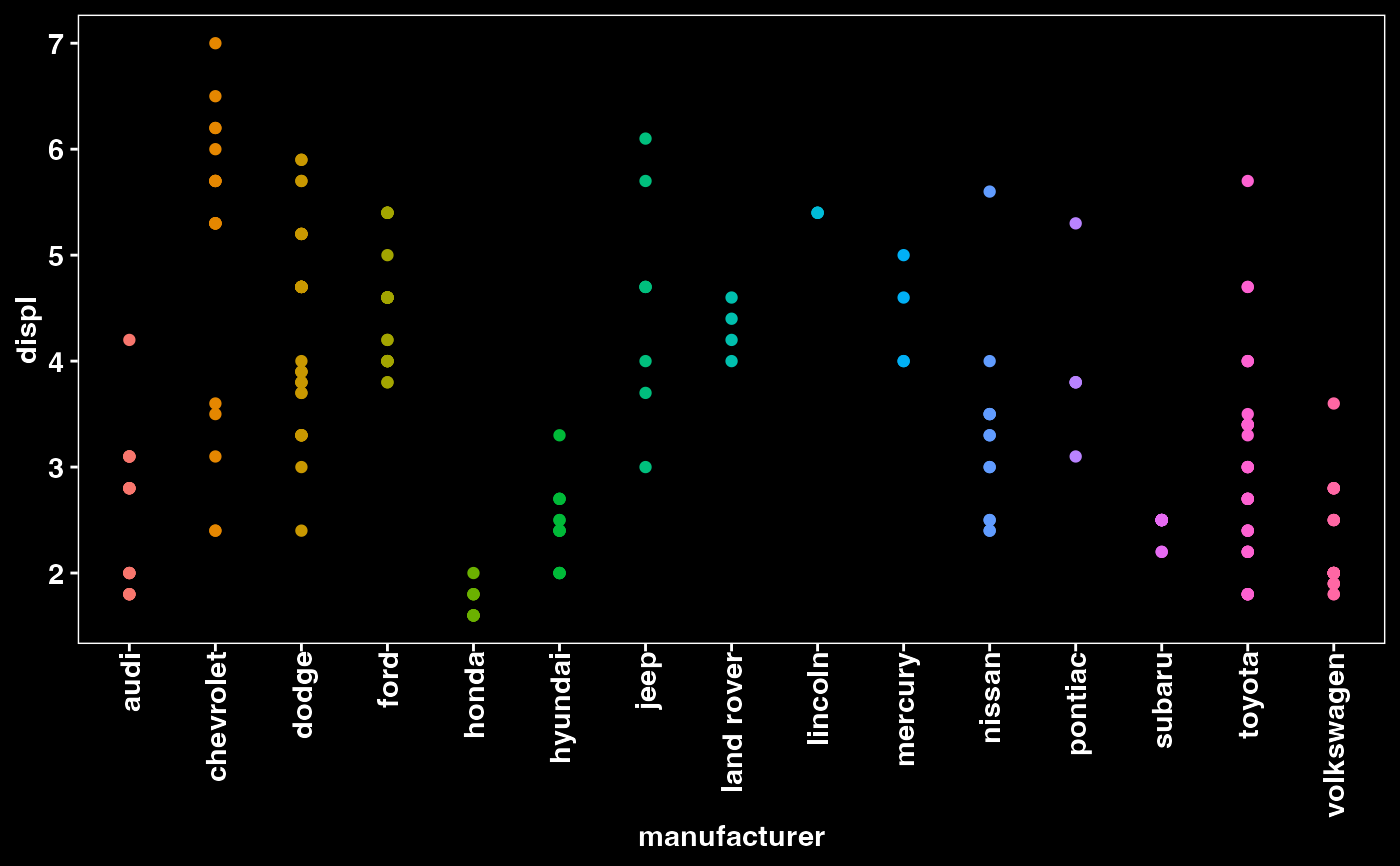
SeelightPalettefor color values.acid_theme_dark(): Dark theme that has a black background and white text.
Inspired bySeurat::DarkTheme(), with some color modifications.
Useful for visualizing many points with a high dynamic color range, such dimension reduction plots.
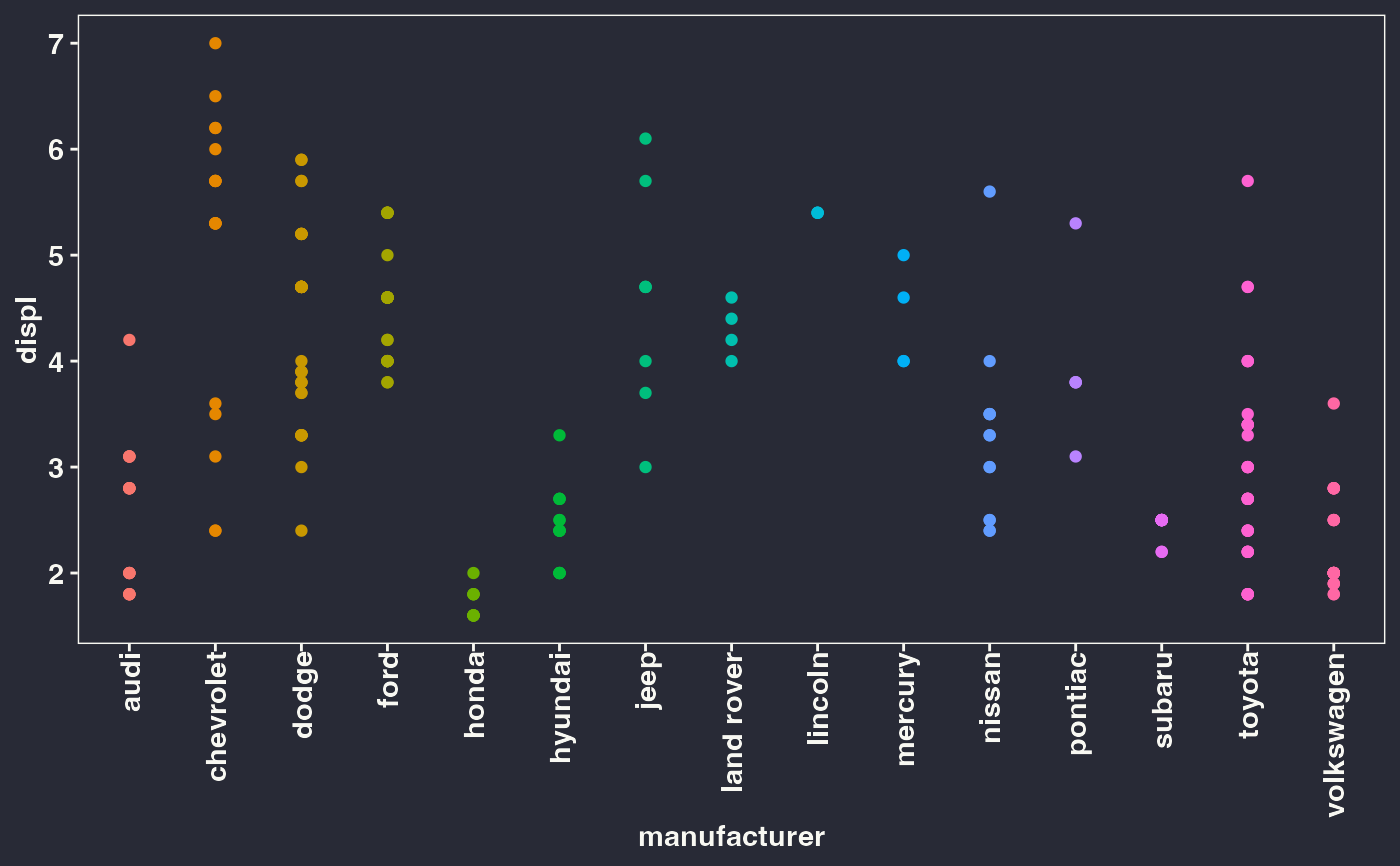
SeedarkPalettefor color values.acid_theme_dracula(): Dark theme that uses Dracula color palette.
SeedraculaPalettefor color values.
Examples
library(ggplot2)
p <- ggplot(
data = mpg,
mapping = aes(
x = manufacturer,
y = displ,
color = manufacturer,
fill = manufacturer
)
) +
geom_point()
## Light theme.
p + acid_theme_light(legend_position = "none")
 ## Dark theme.
p + acid_theme_dark(legend_position = "none")
## Dark theme.
p + acid_theme_dark(legend_position = "none")
 ## Dracula theme.
p + acid_theme_dracula(legend_position = "none")
## Dracula theme.
p + acid_theme_dracula(legend_position = "none")