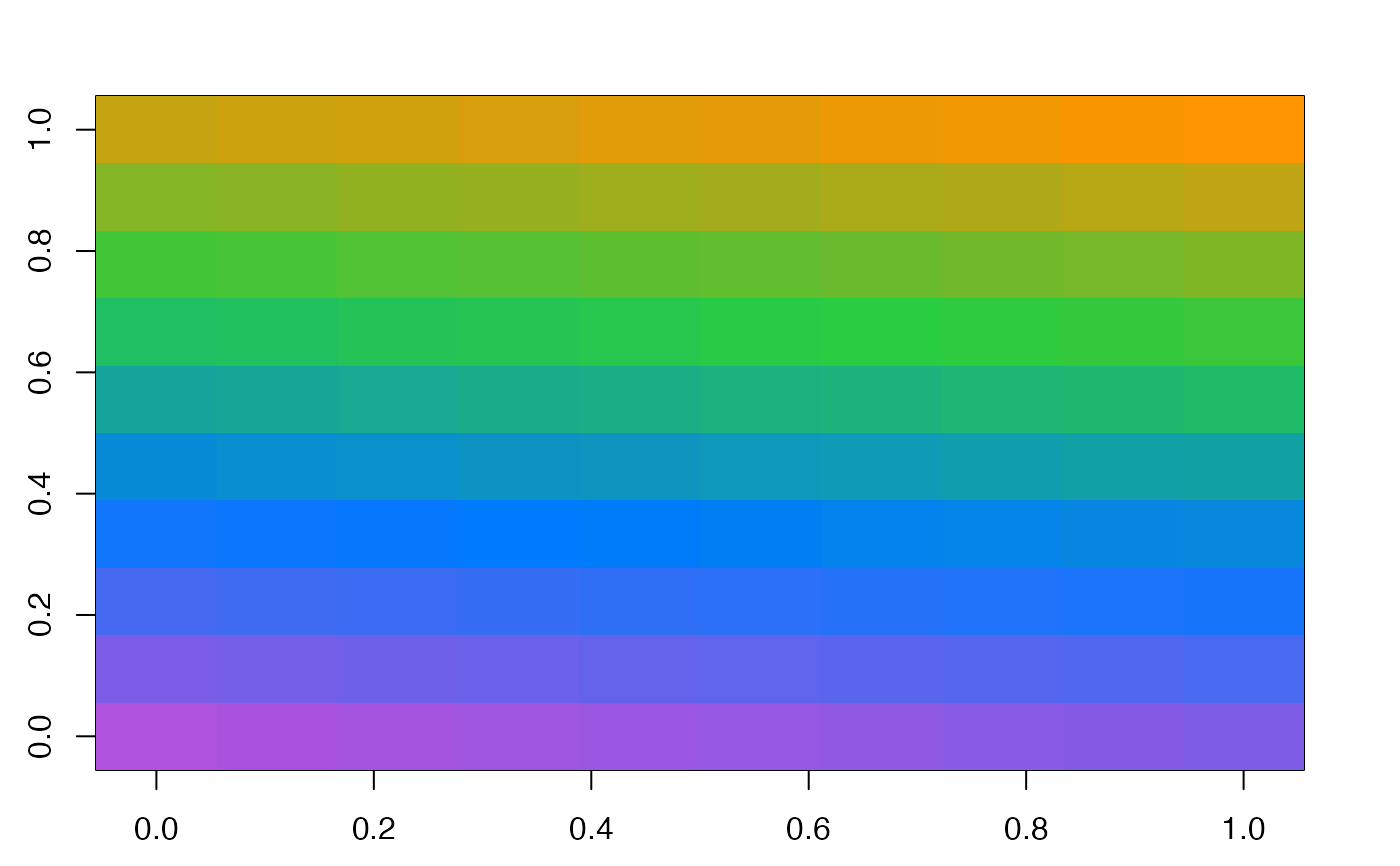
Four color gradient defined by purple, blue, green, orange.
Usage
synesthesia(
  n = 256L,
  palette = c("lightPalette", "darkPalette", "draculaPalette", "macOSLightPalette",
    "macOSDarkPalette", "iOSLightPalette", "iOSDarkPalette")
)

synesthesia_pal(
  palette = c("lightPalette", "darkPalette", "draculaPalette", "macOSLightPalette",
    "macOSDarkPalette", "iOSLightPalette", "iOSDarkPalette")
)

scale_colour_synesthesia_c(
  ...,
  na.value = "grey50",
  guide = "colourbar",
  palette = c("lightPalette", "darkPalette", "draculaPalette", "macOSLightPalette",
    "macOSDarkPalette", "iOSLightPalette", "iOSDarkPalette")
)

acid_scale_color_synesthesia_c(
  ...,
  na.value = "grey50",
  guide = "colourbar",
  palette = c("lightPalette", "darkPalette", "draculaPalette", "macOSLightPalette",
    "macOSDarkPalette", "iOSLightPalette", "iOSDarkPalette")
)

scale_colour_synesthesia_d(
  ...,
  palette = c("lightPalette", "darkPalette", "draculaPalette", "macOSLightPalette",
    "macOSDarkPalette", "iOSLightPalette", "iOSDarkPalette")
)

acid_scale_color_synesthesia_d(
  ...,
  palette = c("lightPalette", "darkPalette", "draculaPalette", "macOSLightPalette",
    "macOSDarkPalette", "iOSLightPalette", "iOSDarkPalette")
)

acid_scale_fill_synesthesia_c(
  ...,
  na.value = "grey50",
  guide = "colourbar",
  palette = c("lightPalette", "darkPalette", "draculaPalette", "macOSLightPalette",
    "macOSDarkPalette", "iOSLightPalette", "iOSDarkPalette")
)

acid_scale_fill_synesthesia_d(
  ...,
  palette = c("lightPalette", "darkPalette", "draculaPalette", "macOSLightPalette",
    "macOSDarkPalette", "iOSLightPalette", "iOSDarkPalette")
)
Arguments
- n
integer(1). The number of colors (>= 1) to be in the palette.- palette
character(1). Color palette name.- ...
Additional arguments.
- na.value
character(1). Missing values will be replaced with this value.- guide
character(1)orfunction. A function used to create a guide or its name. Seeggplot2::guidesfor details.
See also
Adapted from viridis color palette:
viridis::scale_color_viridis_c().viridis::scale_color_viridis_d().viridis::scale_fill_viridis_c().viridis::scale_fill_viridis_d().
Useful color palette URLs:
http://www.stat.columbia.edu/~tzheng/files/Rcolor.pdf
https://matplotlib.org/tutorials/colors/colormaps.html
http://colorbrewer2.org/
http://colorspace.r-forge.r-project.org/
http://hclwizard.org/
https://developer.apple.com/design/human-interface-guidelines/
https://blog.datawrapper.de/colors-for-data-vis-style-guides/
Additional color palette functions that may be relevant:
gplots::col2hex().Seurat::CustomPalette(),Seurat::PurpleAndYellow().colorRamps::matlab.like(),colorRamps::matlab.like2().
Examples
suppressPackageStartupMessages({
library(ggplot2)
})
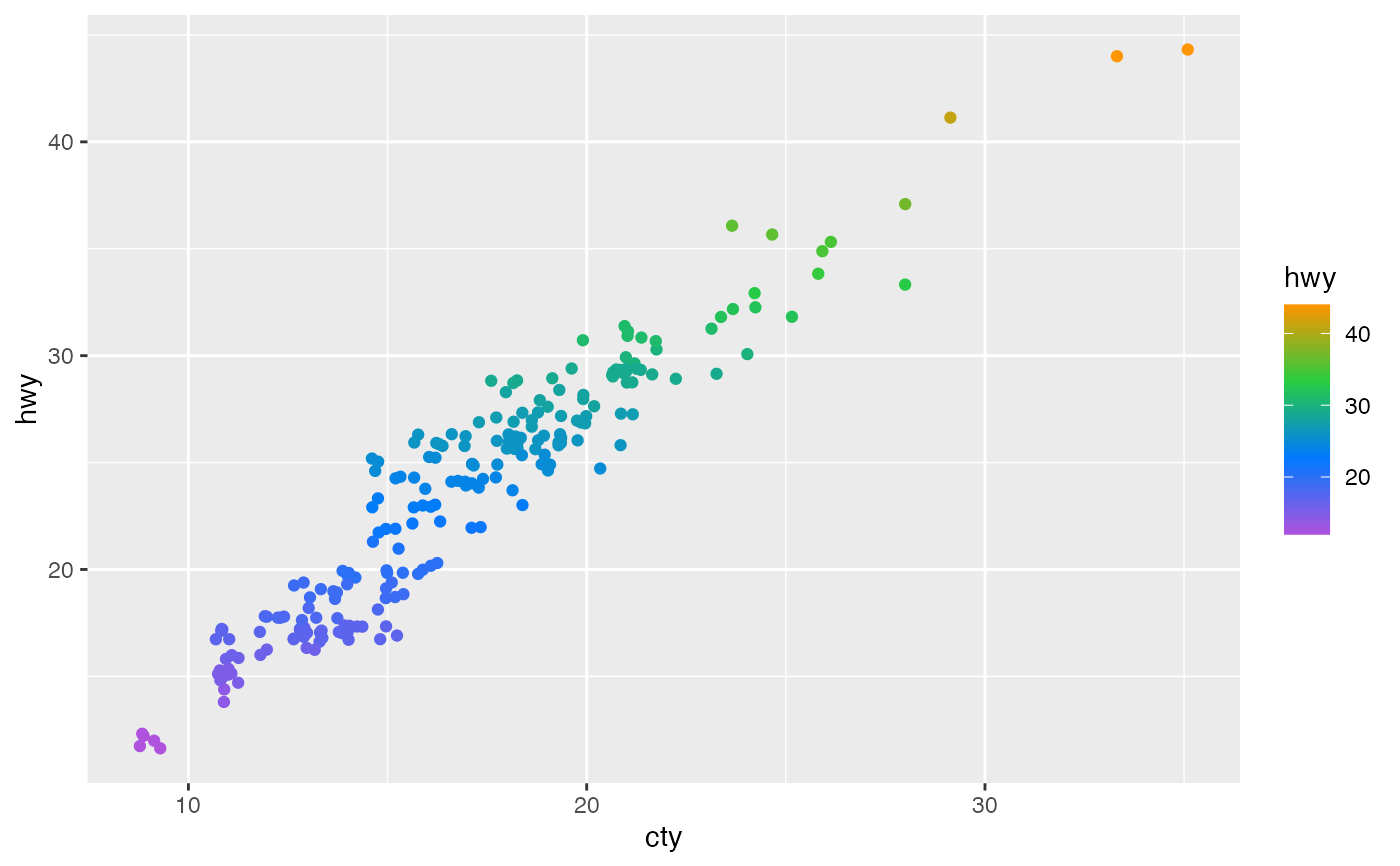
## Color, continuous.
cc <- ggplot(mpg, aes(cty, hwy)) +
geom_jitter(aes(color = hwy))
cc + acid_scale_color_synesthesia_c()
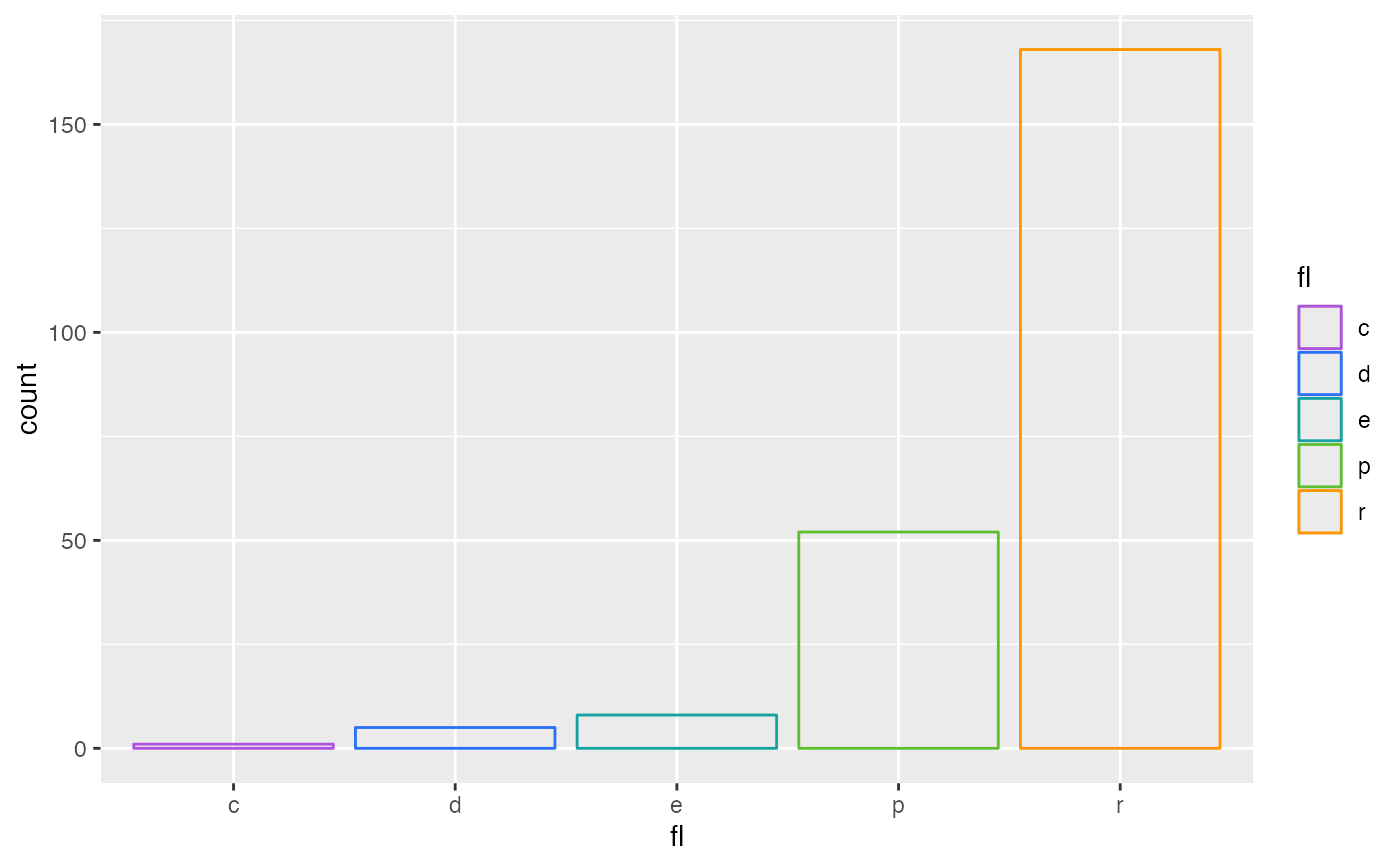
 ## Color, discrete.
cd <- ggplot(mpg, aes(fl)) +
geom_bar(aes(color = fl), fill = NA)
cd + acid_scale_color_synesthesia_d()
## Color, discrete.
cd <- ggplot(mpg, aes(fl)) +
geom_bar(aes(color = fl), fill = NA)
cd + acid_scale_color_synesthesia_d()
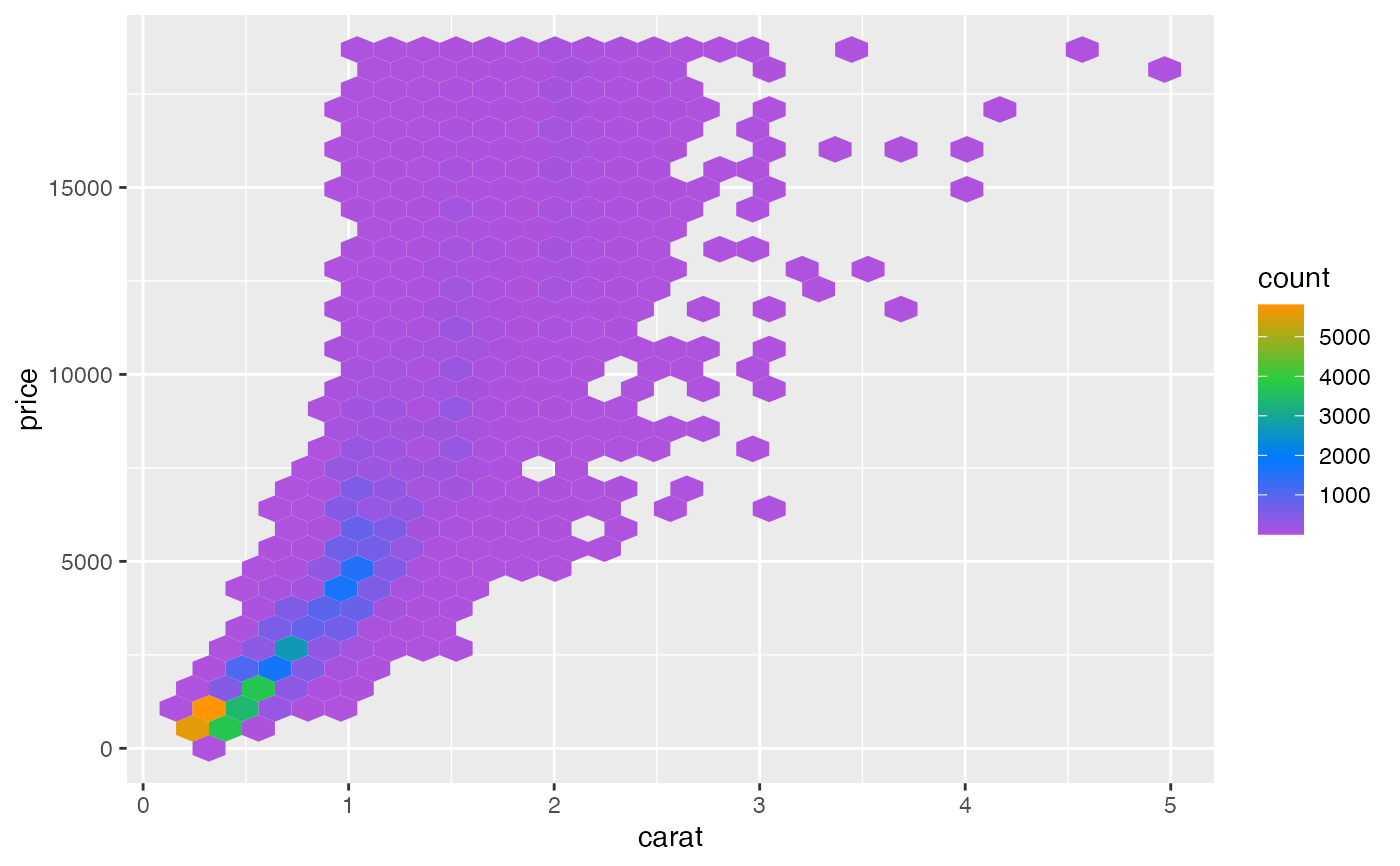
 ## Fill, continuous.
fc <- ggplot(diamonds, aes(carat, price)) +
geom_hex()
fc + acid_scale_fill_synesthesia_c()
#> Warning: Computation failed in `stat_binhex()`.
#> Caused by error in `compute_group()`:
#> ! The package "hexbin" is required for `stat_bin_hex()`.
## Fill, continuous.
fc <- ggplot(diamonds, aes(carat, price)) +
geom_hex()
fc + acid_scale_fill_synesthesia_c()
#> Warning: Computation failed in `stat_binhex()`.
#> Caused by error in `compute_group()`:
#> ! The package "hexbin" is required for `stat_bin_hex()`.
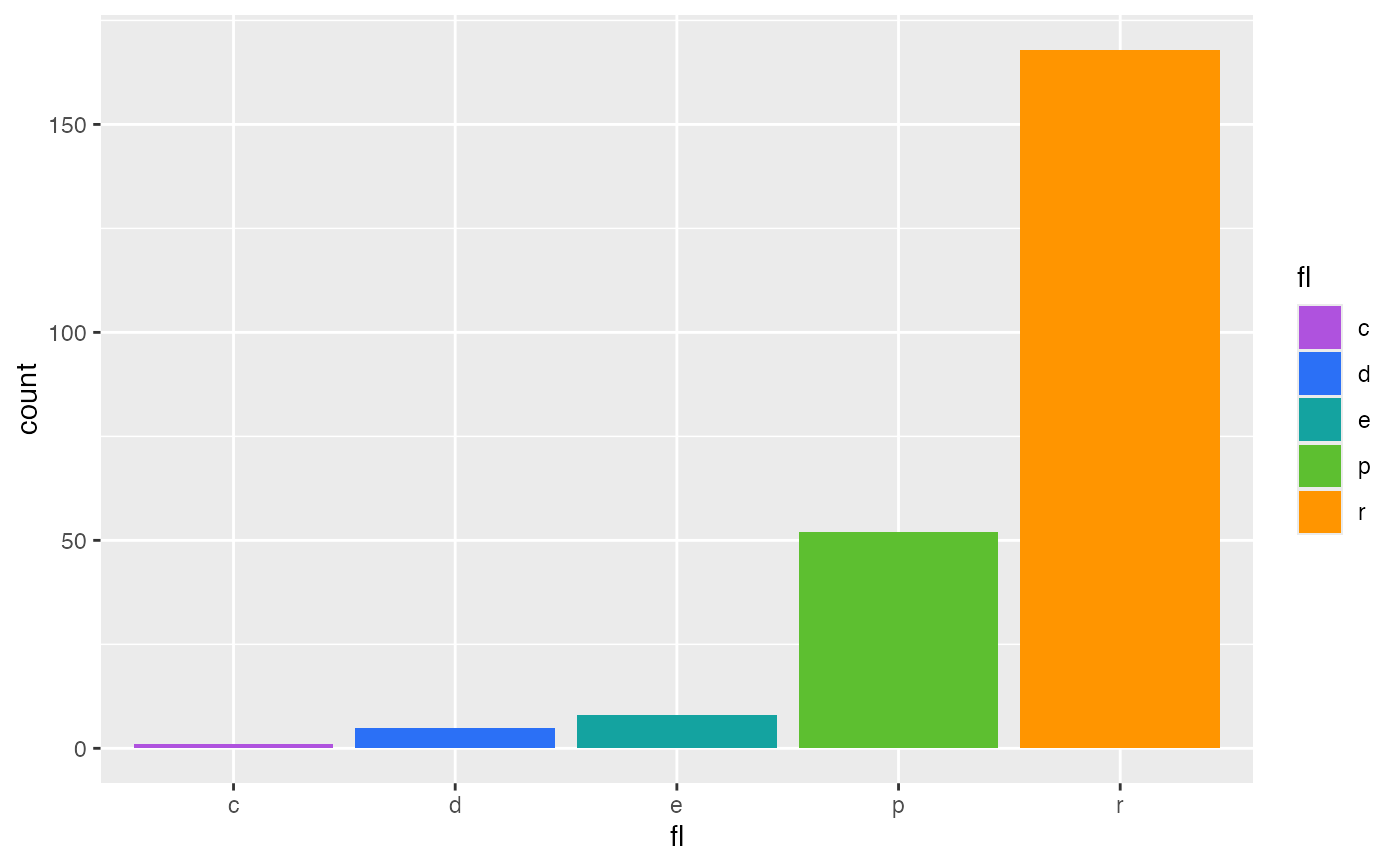
 ## Fill, discrete.
fd <- ggplot(mpg, aes(fl)) +
geom_bar(aes(fill = fl))
fd + acid_scale_fill_synesthesia_d()
## Fill, discrete.
fd <- ggplot(mpg, aes(fl)) +
geom_bar(aes(fill = fl))
fd + acid_scale_fill_synesthesia_d()
 ## Base color.
par(mar = rep(2.5, times = 4L))
image(
matrix(data = seq_len(100L), nrow = 10, ncol = 10),
col = synesthesia()
)
## Base color.
par(mar = rep(2.5, times = 4L))
image(
matrix(data = seq_len(100L), nrow = 10, ncol = 10),
col = synesthesia()
)