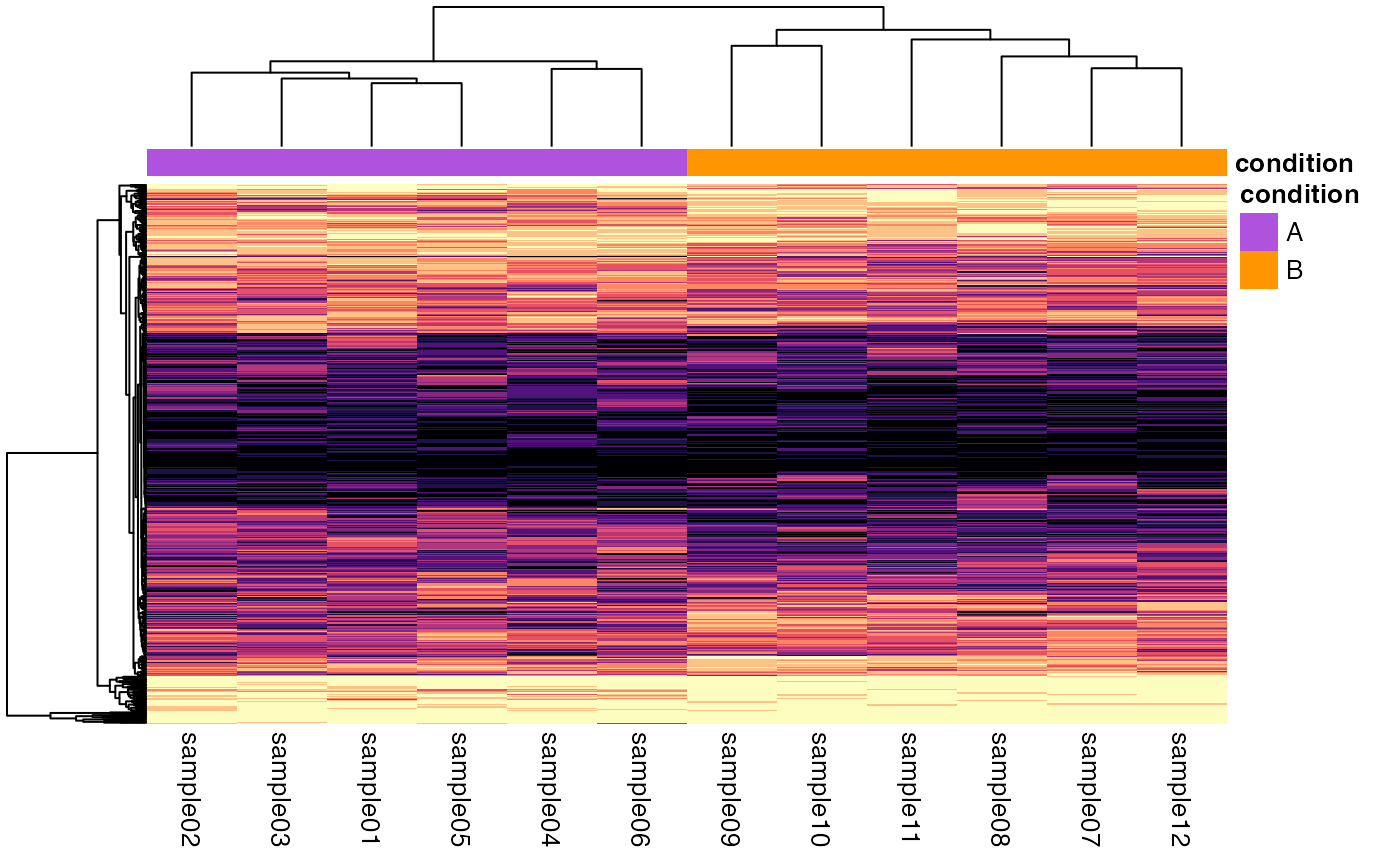
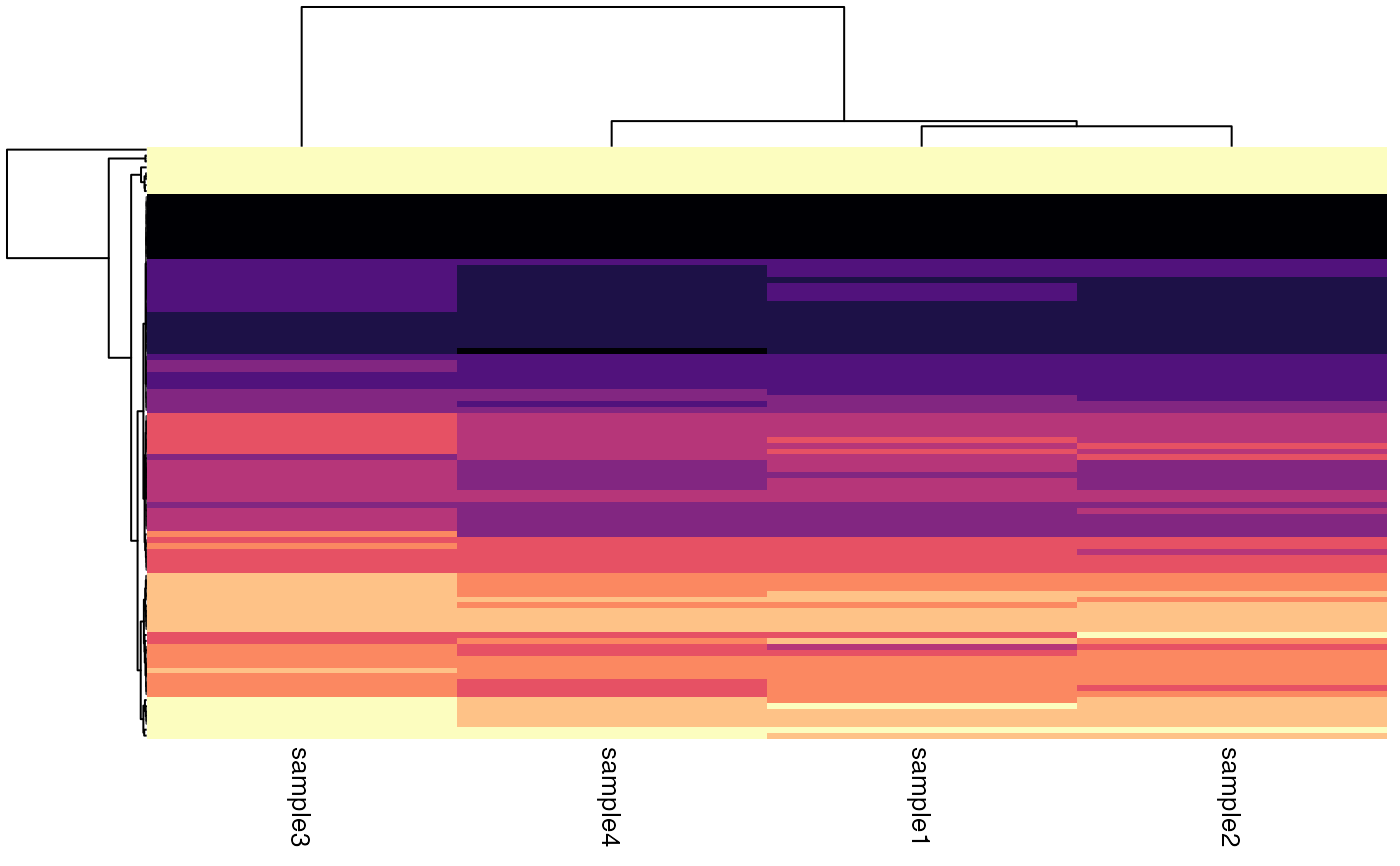
Quantile heatmap
Usage
plotQuantileHeatmap(object, ...)

# S4 method for class 'SingleCellExperiment'
plotQuantileHeatmap(object, ...)

# S4 method for class 'SummarizedExperiment'
plotQuantileHeatmap(
  object,
  assay = 1L,
  interestingGroups = NULL,
  n = 10L,
  clusterRows = TRUE,
  clusterCols = TRUE,
  showRownames = isTRUE(nrow(object) <= 30L),
  showColnames = TRUE,
  treeheightRow = 50L,
  treeheightCol = 50L,
  color = getOption(x = "acid.heatmap.quantile.color", default = viridis::magma),
  legendColor = getOption(x = "acid.heatmap.legend.color", default =
    AcidPlots::synesthesia),
  legend = FALSE,
  borderColor = NULL,
  title = NULL,
  convertGenesToSymbols = showRownames,
  ...
)
Arguments
- object
Object.
- ...
Additional arguments.
- assay
vector(1). Assay name or index position.- interestingGroups
character. Groups of interest to use for visualization. Corresponds to factors describing the columns of the object.- n
integer(1). The number of quantile breaks to create.- clusterRows, clusterCols
logical(1). Arrange with hierarchical clustering.- showRownames, showColnames
logical(1). Show row or column names.- treeheightRow, treeheightCol
integer(1). Size of the row and column dendrograms. Use0to disable.- color
function,character, orNULL. Hexadecimal color function or values to use for plot.We generally recommend these hexadecimal functions from the viridis package, in addition to our
synesthesia()palette:Alternatively, colors can be defined manually using hexadecimal values (e.g.
c("#FF0000", "#0000FF")), but this is not generally recommended. Refer to the RColorBrewer package for hexadecimal color palettes that may be suitable. If setNULL, will use the default pheatmap colors.- legendColor
functionorNULL. Hexadecimal color function to use for legend labels. Note that hexadecimal values are not supported. If setNULL, will use the default pheatmap colors.- legend
logical(1). Show the color legend.- borderColor
character(1)orNULL. Border color.- title
character(1). Title.- convertGenesToSymbols
logical(1). Attempt to automatically convert gene identifiers to gene symbols. Only applies when object contains mappings defined inrowRanges.
Examples
data(
    RangedSummarizedExperiment,
    SingleCellExperiment_splatter,
    package = "AcidTest"
)

## SummarizedExperiment ====
object <- RangedSummarizedExperiment
plotQuantileHeatmap(object)


## SingleCellExperiment ====
object <- SingleCellExperiment_splatter
plotQuantileHeatmap(object)
