Heatmap
Usage
plotHeatmap(object, ...)

# S4 method for class 'SingleCellExperiment'
plotHeatmap(object, ...)

# S4 method for class 'SummarizedExperiment'
plotHeatmap(
  object,
  assay = 1L,
  interestingGroups = NULL,
  scale = c("row", "column", "none"),
  clusteringMethod = "ward.D2",
  clusterRows = TRUE,
  clusterCols = TRUE,
  showRownames = isTRUE(nrow(object) <= 30L),
  showColnames = TRUE,
  treeheightRow = 50L,
  treeheightCol = 50L,
  color = getOption(x = "acid.heatmap.color", default = AcidPlots::blueYellow),
  legendColor = getOption(x = "acid.heatmap.legend.color", default =
    AcidPlots::synesthesia),
  breaks = seq(from = -3L, to = 3L, by = 0.25),
  legendBreaks = seq(from = -3L, to = 3L, by = 1L),
  borderColor = NULL,
  title = NULL,
  convertGenesToSymbols = showRownames,
  ...
)
Arguments
- object
Object.
- ...
Passthrough arguments to
pheatmap(). The argument names must be formatted in camel case, not snake case.- assay
vector(1). Assay name or index position.- interestingGroups
character. Groups of interest to use for visualization. Corresponds to factors describing the columns of the object.- scale
character(1). Whether the values should be centered and scaled in either the row or column direction, or remain unscaled.- clusteringMethod
character(1). Clustering method. Accepts the same values ashclust().- clusterRows, clusterCols
logical(1). Arrange with hierarchical clustering.- showRownames, showColnames
logical(1). Show row or column names.- treeheightRow, treeheightCol
integer(1). Size of the row and column dendrograms. Use0to disable.- color
function,character, orNULL. Hexadecimal color function or values to use for plot.We generally recommend these hexadecimal functions from the viridis package, in addition to our
synesthesia()palette:Alternatively, colors can be defined manually using hexadecimal values (e.g.
c("#FF0000", "#0000FF")), but this is not generally recommended. Refer to the RColorBrewer package for hexadecimal color palettes that may be suitable. If setNULL, will use the default pheatmap colors.- legendColor
functionorNULL. Hexadecimal color function to use for legend labels. Note that hexadecimal values are not supported. If setNULL, will use the default pheatmap colors.- breaks
numericorNULL. A sequence of numbers that covers the range of values in the matrix. Must be 1 element longer than the color vector, which is handled internally automatically, differing from the behavior in pheatmap.- legendBreaks
numericorNULL. Numeric vector of breakpoints for the color legend.- borderColor
character(1)orNULL. Border color.- title
character(1). Title.- convertGenesToSymbols
logical(1). Attempt to automatically convert gene identifiers to gene symbols. Only applies when object contains mappings defined inrowRanges.
Scaling
Here we're scaling simply by calculating the standard score (z-score).
mu: mean.
sigma: standard deviation.
x: raw score (e.g. count matrix).
z: standard score (z-score).
See also:
pheatmap:::scale_rows().scale()for additional scaling approaches.
Hierarchical clustering
Row- and column-wise hierarchical clustering is performed when clusterRows
and/or clusterCols are set to TRUE. Internally, this calls hclust(),
and defaults to the Ward method.
Automatic hierarchical clustering of rows and/or columns can error for some datasets. When this occurs, you'll likely see this error:
In this case, either set clusterRows and/or clusterCols to FALSE, or
you can attempt to pass an hclust object to these arguments. This is
recommended as an alternate approach to be used with pheatmap(), which is
called internally by our plotting code. Here's how this can be accomplished:
Examples
data(
RangedSummarizedExperiment,
SingleCellExperiment_splatter,
package = "AcidTest"
)
## SummarizedExperiment ====
object <- RangedSummarizedExperiment
## Row scaling requires non-zero rows.
object <- AcidGenerics::nonzeroRowsAndCols(object)
#> ℹ Filtered zero count rows and columns:
#> - 499 / 500 rows (100%)
#> - 12 / 12 columns (100%)
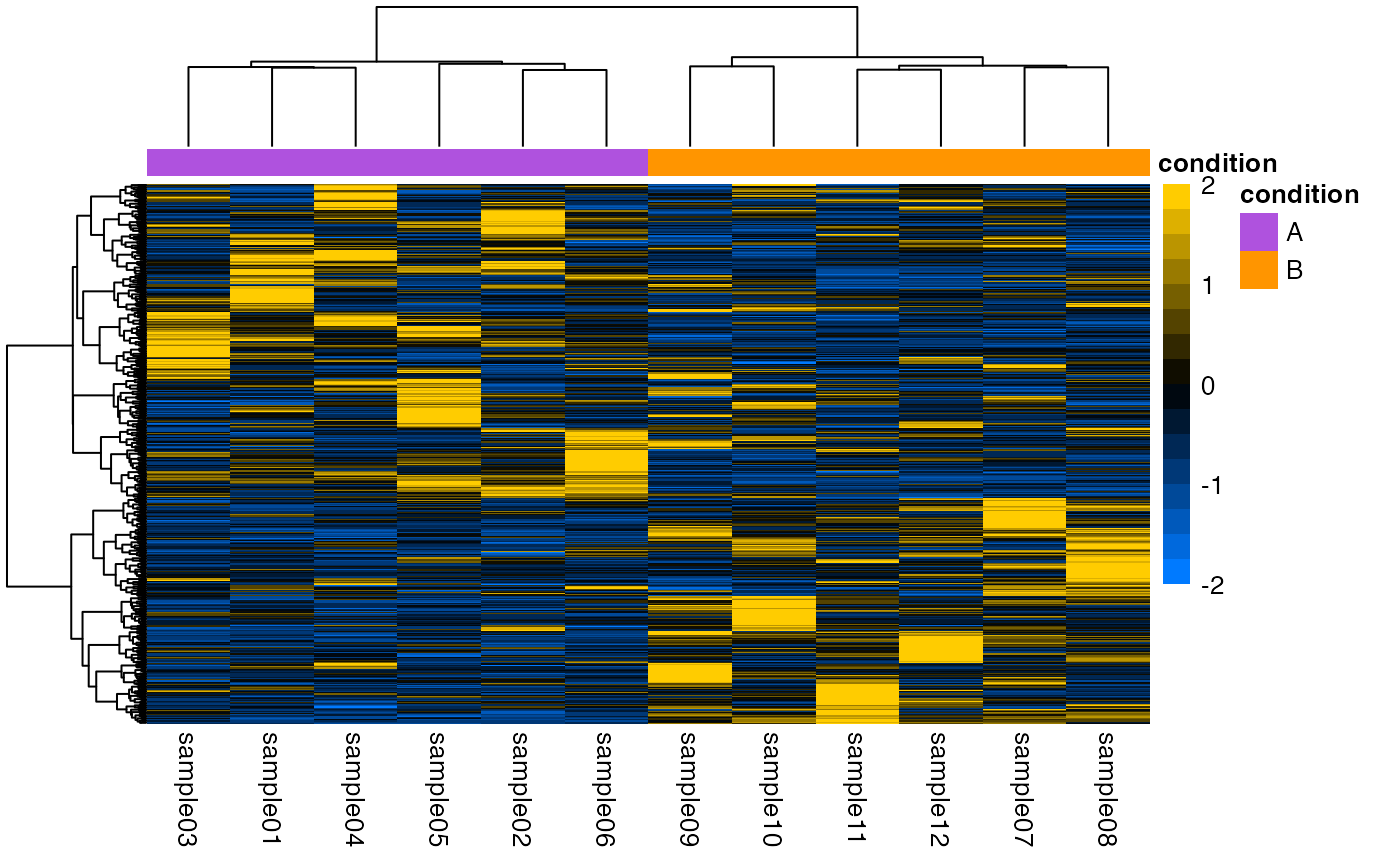
## Symmetric row-scaled breaks (recommended).
plotHeatmap(
object,
scale = "row",
color = AcidPlots::blueYellow,
breaks = seq(from = -2L, to = 2L, by = 0.25),
legendBreaks = seq(from = -2L, to = 2L, by = 1L)
)
#> → Scaling matrix per row (z-score).
#> → Performing hierarchical clustering with `hclust()` method "ward.D2".
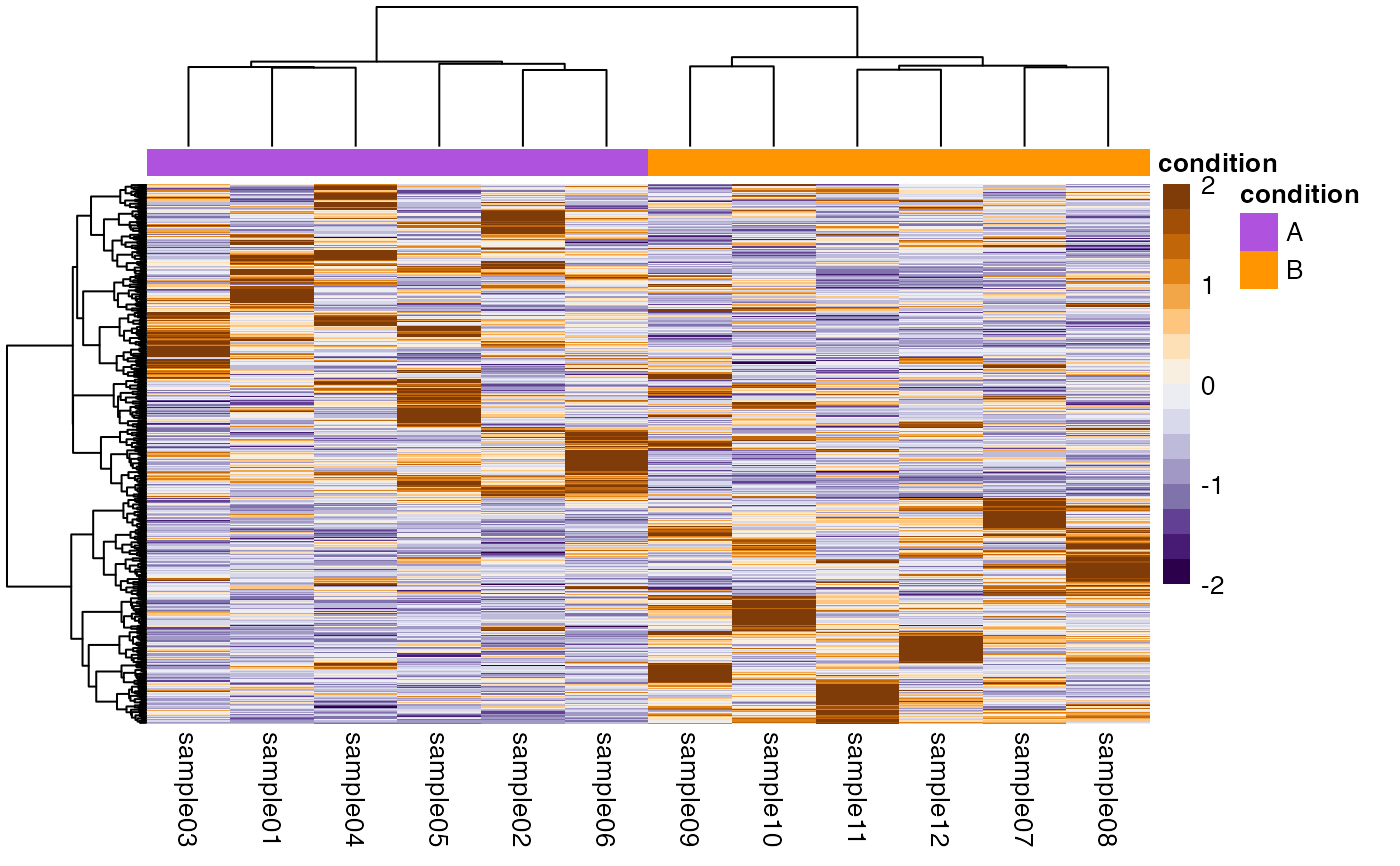
 ## Using custom hexadecimal color input.
if (goalie::isInstalled("RColorBrewer")) {
color <- rev(RColorBrewer::brewer.pal(n = 11L, name = "PuOr"))
color <- grDevices::colorRampPalette(color)
head(color)
plotHeatmap(
object = object,
scale = "row",
color = color,
breaks = seq(from = -2L, to = 2L, by = 0.25),
legendBreaks = seq(from = -2L, to = 2L, by = 1L)
)
}
#> → Scaling matrix per row (z-score).
#> → Performing hierarchical clustering with `hclust()` method "ward.D2".
## Using custom hexadecimal color input.
if (goalie::isInstalled("RColorBrewer")) {
color <- rev(RColorBrewer::brewer.pal(n = 11L, name = "PuOr"))
color <- grDevices::colorRampPalette(color)
head(color)
plotHeatmap(
object = object,
scale = "row",
color = color,
breaks = seq(from = -2L, to = 2L, by = 0.25),
legendBreaks = seq(from = -2L, to = 2L, by = 1L)
)
}
#> → Scaling matrix per row (z-score).
#> → Performing hierarchical clustering with `hclust()` method "ward.D2".
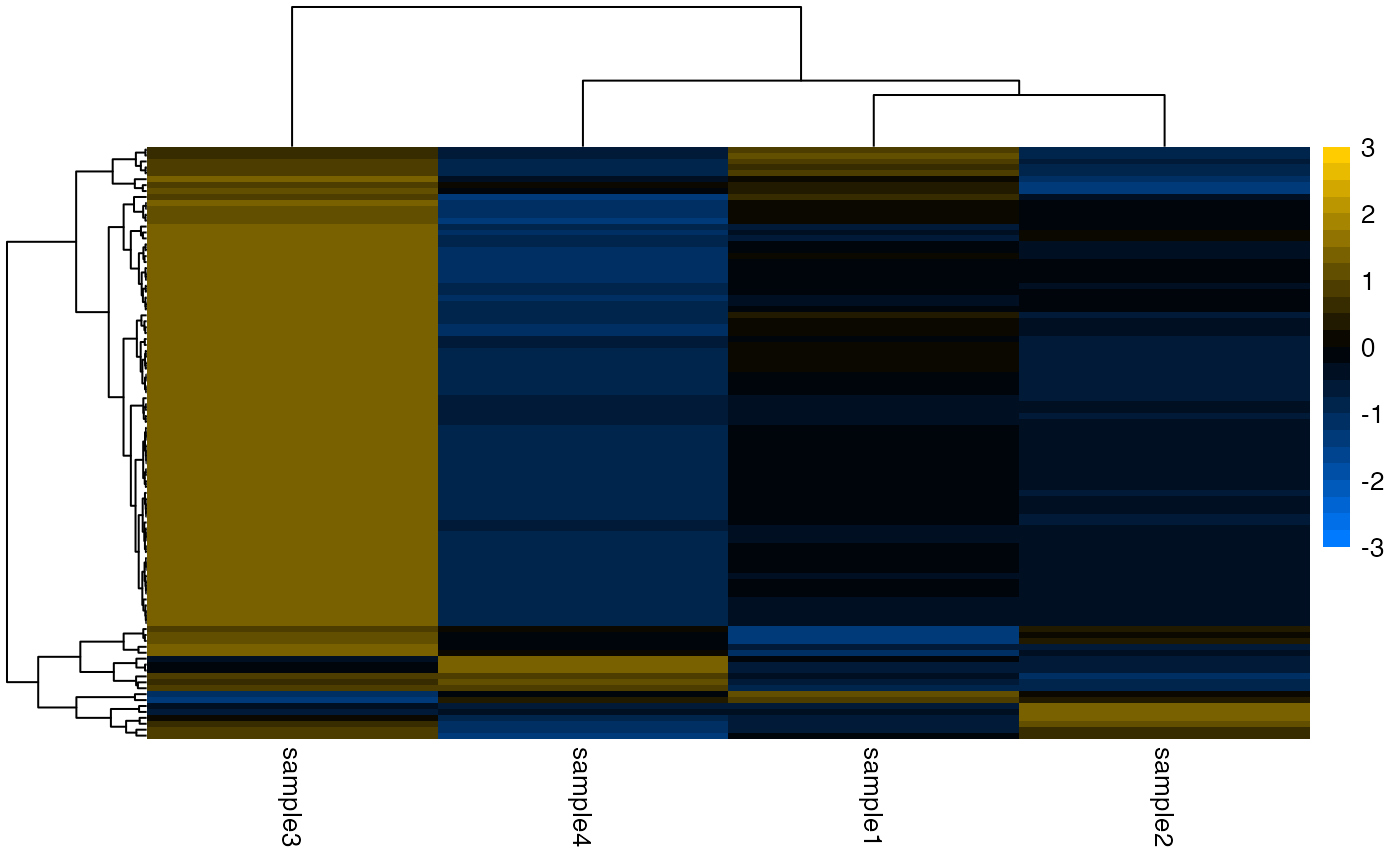
 ## SingleCellExperiment ====
object <- SingleCellExperiment_splatter
## Row scaling requires non-zero rows.
object <- AcidGenerics::nonzeroRowsAndCols(object)
plotHeatmap(object)
#> → Scaling matrix per row (z-score).
#> → Performing hierarchical clustering with `hclust()` method "ward.D2".
## SingleCellExperiment ====
object <- SingleCellExperiment_splatter
## Row scaling requires non-zero rows.
object <- AcidGenerics::nonzeroRowsAndCols(object)
plotHeatmap(object)
#> → Scaling matrix per row (z-score).
#> → Performing hierarchical clustering with `hclust()` method "ward.D2".