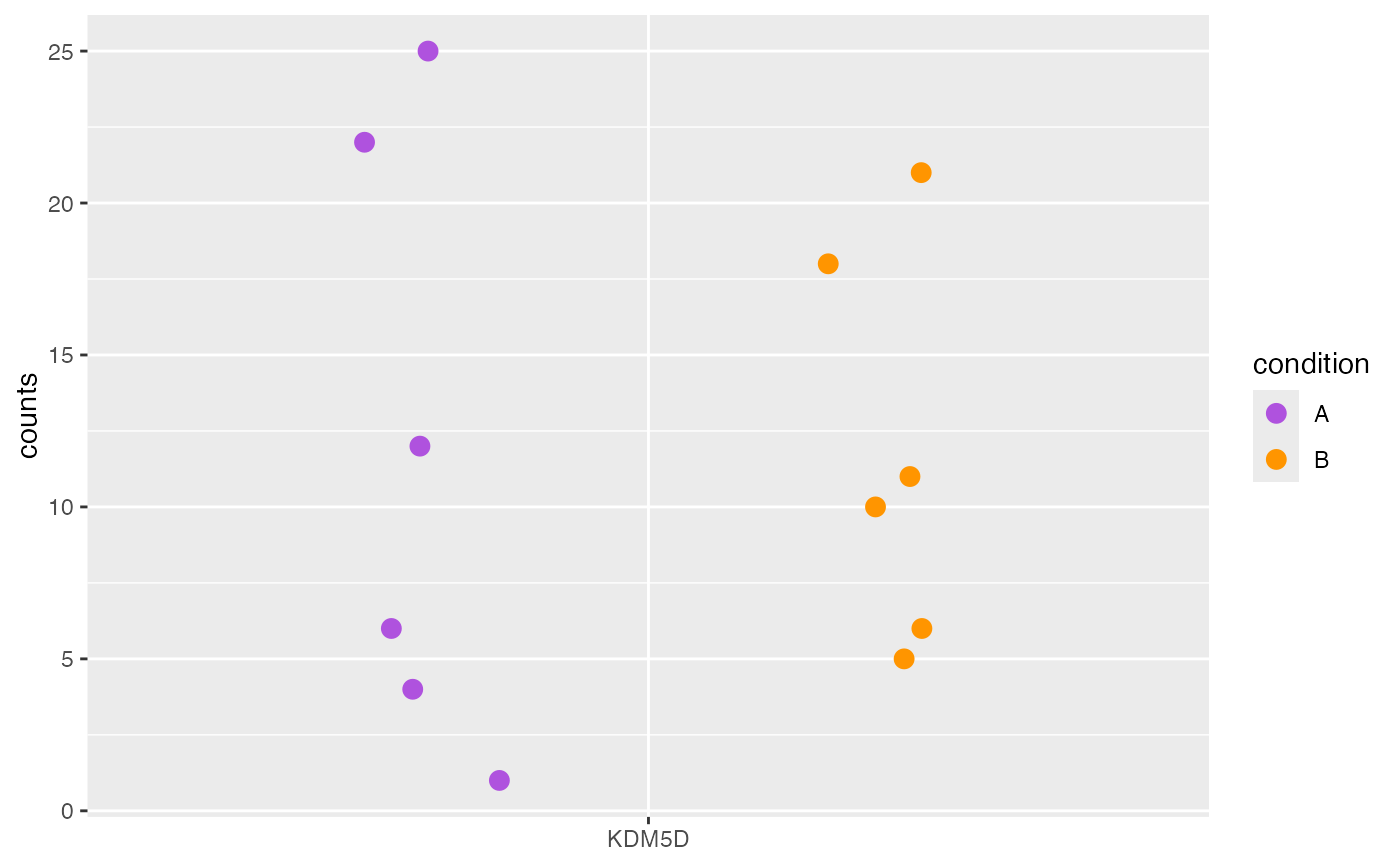
Plot sexually dimorphic gender marker genes
Source:R/AllGenerics.R, R/plotGenderMarkers-methods.R
plotGenderMarkers.RdThis is a convenience function that quickly plots known sexually dimorphic genes, and overall gene experssion for the X and Y chromosomes.
Usage
plotGenderMarkers(object, ...)

# S4 method for class 'SingleCellExperiment'
plotGenderMarkers(object, ...)

# S4 method for class 'SummarizedExperiment'
plotGenderMarkers(object, style = "wide", ...)
Arguments
- object
Object.
- ...
Passthrough to
plotCounts(), with thegenesargument automatically defined.- style
character(1). Plot style.
Examples
data(
    RangedSummarizedExperiment,
    SingleCellExperiment_splatter,
    package = "AcidTest"
)

## SummarizedExperiment ====
object <- RangedSummarizedExperiment
try({
    plotGenderMarkers(object)
})
#> ! Failed to map 5 genes: "ENSG00000067048", "ENSG00000114374", "ENSG00000173674", "ENSG00000183878", "ENSG00000229807".


## SingleCellExperiment ====
object <- SingleCellExperiment_splatter
try({
    plotGenderMarkers(object)
})
#> ! Failed to map 6 genes: "ENSG00000012817", "ENSG00000067048", "ENSG00000114374", "ENSG00000173674", "ENSG00000183878"....
#> Error in stop(simpleError(message = msg, call = if (p <- sys.parent(1L)) { :
#>   Failed to detect gender markers in object.