Plot counts
Usage
plotCounts(object, ...)

plotDots(object, ...)

plotViolin(object, ...)

# S4 method for class 'SingleCellExperiment'
plotCounts(
  object,
  genes,
  assay = c("logcounts", "normcounts"),
  geom = c("violin", "dots"),
  perSample = TRUE,
  legend = getOption(x = "acid.legend", default = TRUE),
  title = NULL
)

# S4 method for class 'SummarizedExperiment'
plotCounts(
  object,
  genes,
  assay = 1L,
  interestingGroups = NULL,
  convertGenesToSymbols = TRUE,
  geom = c("point", "violin", "boxplot", "bar"),
  trans = c("identity", "log2", "log10"),
  line = c("none", "median", "mean", "geometricMean"),
  legend = getOption(x = "acid.legend", default = TRUE),
  style = c("facet", "wide"),
  sort = FALSE,
  labels = list(title = NULL, subtitle = NULL, sampleAxis = NULL, countAxis = "counts")
)

# S4 method for class 'SingleCellExperiment'
plotDots(
  object,
  genes,
  perSample = TRUE,
  colMin = -2.5,
  colMax = 2.5,
  dotMin = 0L,
  dotScale = 6L,
  color = getOption(x = "acid.continuous.color", default =
    ggplot2::scale_color_gradient2(low = "orange", mid = "gray75", high = "purple",
    midpoint = 0L)),
  legend = getOption(x = "acid.legend", default = TRUE),
  title = NULL
)

# S4 method for class 'SingleCellExperiment'
plotViolin(
  object,
  genes,
  assay = c("logcounts", "normcounts"),
  perSample = TRUE,
  scale = c("count", "width", "area"),
  color = getOption(x = "acid.discrete.color", default =
    AcidPlots::acid_scale_color_synesthesia_d()),
  legend = getOption(x = "acid.legend", default = TRUE),
  title = NULL
)
Arguments
- object
Object.
- genes
characterormissing. Gene identifiers. The function will automatically match identifiers corresponding to the rownames of the object, or gene symbols defined in the object.- assay
vector(1). Assay name or index position.- geom
character(1). Plot type. Usesmatch.arg()to pick the type. Currently supports"dots"and"violin".- perSample
logical(1). Visualize the distributions per sample.- legend
logical(1). Include plot legend.- title
character(1). Title.- interestingGroups
character. Groups of interest to use for visualization. Corresponds to factors describing the columns of the object.- convertGenesToSymbols
logical(1). Attempt to automatically convert gene identifiers to gene symbols. Only applies when object contains mappings defined inrowRanges.- trans
character(1). Name of the axis scale transformation to apply.For more information:
- line
character(1). Include average (median, mean, or geometric mean) line for each interesting group. Disabled by default and if samples are colored by sample name.- style
character(1). Plot style.- sort
logical(1). Sort the genes alphabetically. This setting applies to the gene symbols rather than the gene identifiers whenconvertGenesToSymbolsisTRUE.- labels
list. ggplot2 labels. Seeggplot2::labs()for details.- colMin
numeric(1). Minimum scaled average expression threshold. Everything smaller will be set to this.- colMax
numeric(1). Maximum scaled average expression threshold. Everything larger will be set to this.- dotMin
numeric(1). The fraction of cells at which to draw the smallest dot. All cell groups with less than this expressing the given gene will have no dot drawn.- dotScale
numeric(1). Scale the size of the points, similar tocex.- color
ScaleDiscrete. Desired ggplot2 color scale. Must supply discrete values. When setNULL, the default ggplot2 color palette will be used. If manual color definitions are desired, we recommend usingggplot2::scale_color_manual().To set the discrete color palette globally, use:
- scale
character(1). If "area" (default), all violins have the same area (before trimming the tails). If "count", areas are scaled proportionally to the number of observartions. If "width", all violins have the same maximum width. Seeggplot2::geom_violinfor details.- ...
Additional arguments.
Value
style = "facet":ggplotgrouped bysampleName, withggplot2::facet_wrap()applied to panel the samples.style = "wide":ggplotin wide format, with genes on the x-axis.
Examples
data(
    RangedSummarizedExperiment,
    SingleCellExperiment_Seurat,
    package = "AcidTest"
)

## SummarizedExperiment ====
object <- RangedSummarizedExperiment
rownames <- head(rownames(object))
print(rownames)
#> [1] "gene001" "gene002" "gene003" "gene004" "gene005" "gene006"
g2s <- AcidGenomes::GeneToSymbol(object)
geneIds <- head(g2s[[1L]])
print(geneIds)
#> [1] "ENSG00000000003.15" "ENSG00000000005.6"  "ENSG00000000419.12"
#> [4] "ENSG00000000457.14" "ENSG00000000460.17" "ENSG00000000938.13"
geneNames <- head(g2s[[2L]])
print(geneNames)
#> [1] "TSPAN6"   "TNMD"     "DPM1"     "SCYL3"    "C1orf112" "FGR"

## Rownames, gene IDs, and gene names (symbols) are supported.
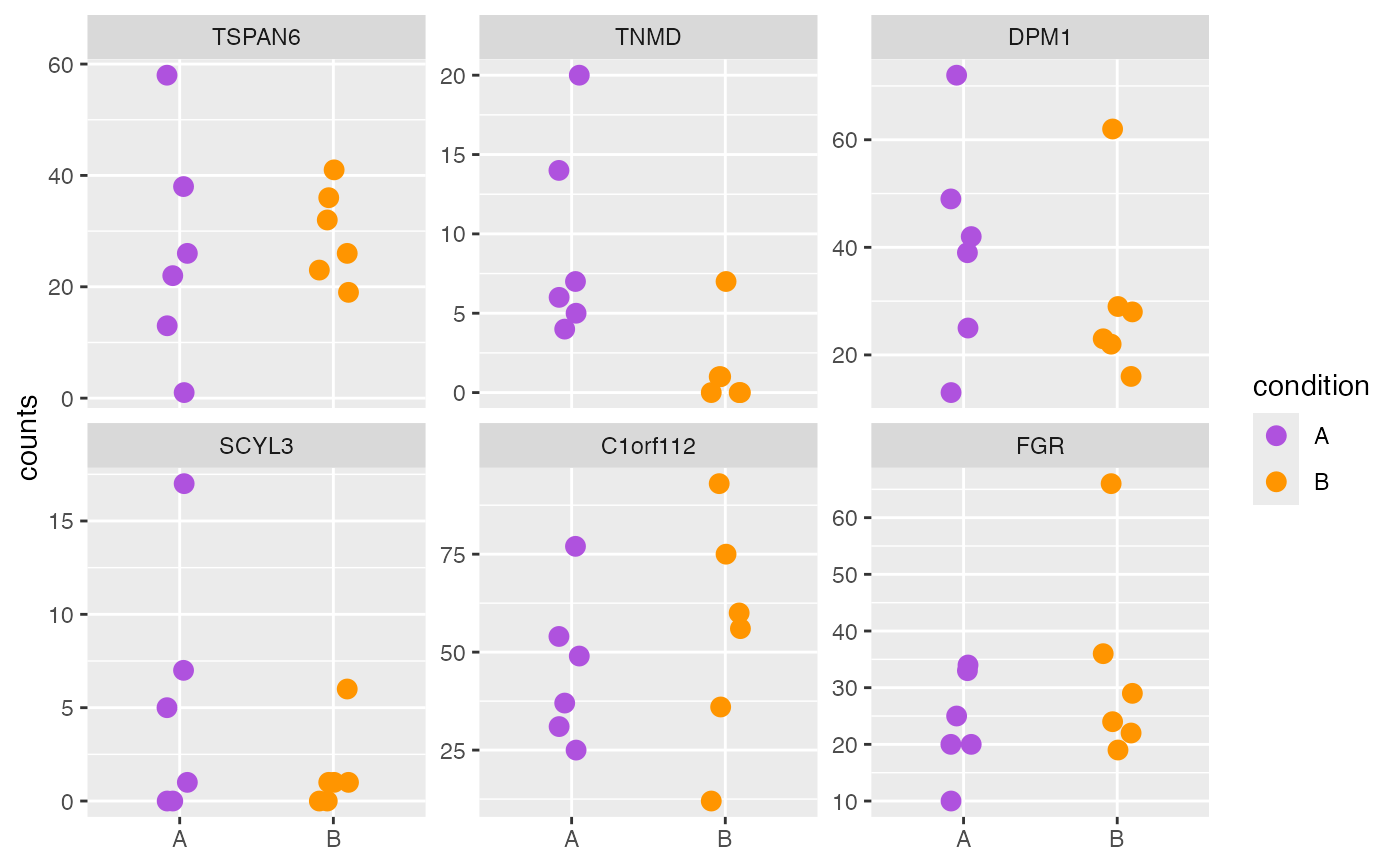
plotCounts(object, genes = geneIds, style = "facet")

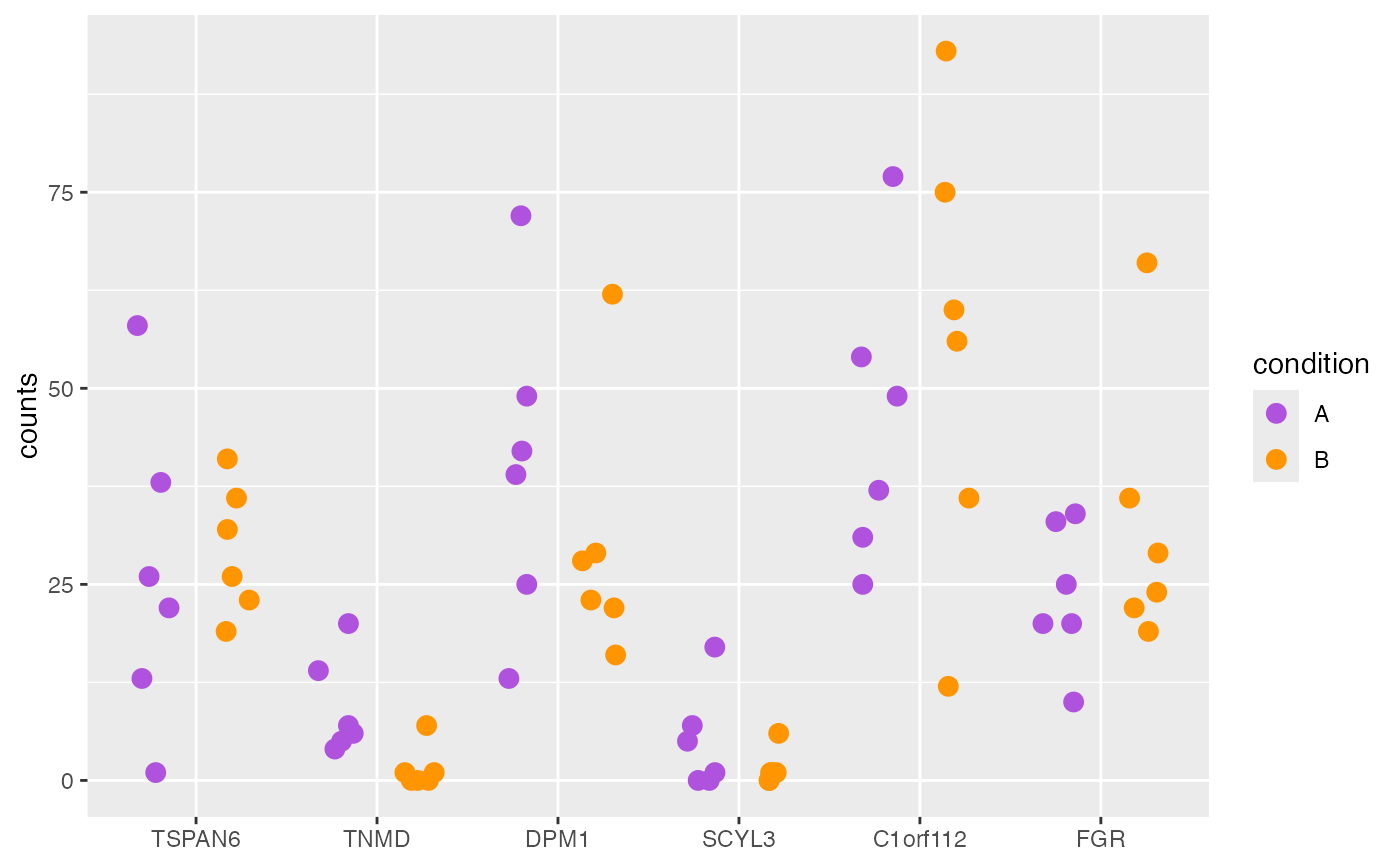
plotCounts(object, genes = geneNames, style = "wide")


## SingleCellExperiment ====
object <- SingleCellExperiment_Seurat

## Plotting with either gene IDs or gene names (symbols) works.
genes <- head(rownames(object), n = 4L)
print(genes)
#> [1] "ENSG00000156738" "ENSG00000007312" "ENSG00000105369" "ENSG00000204287"

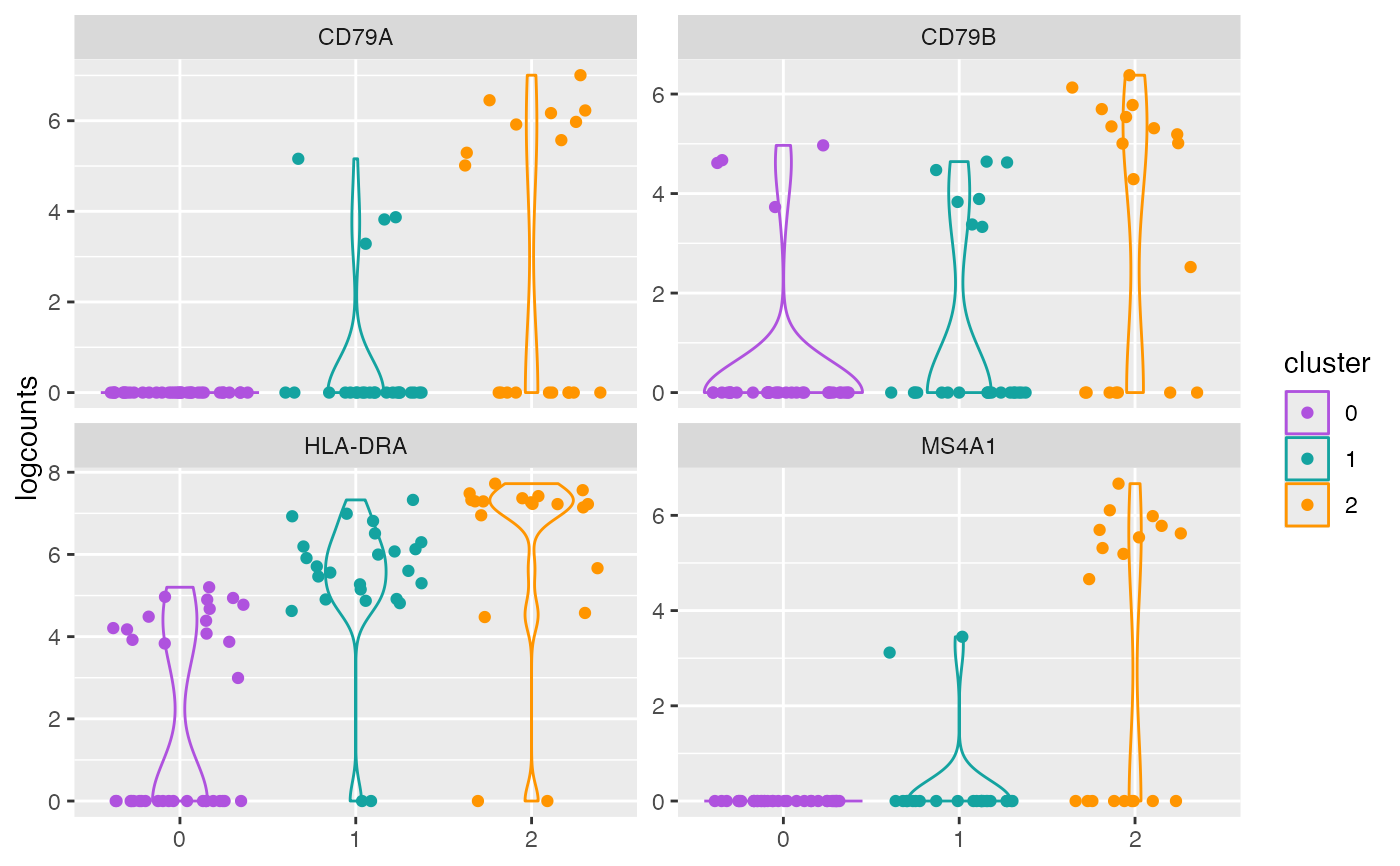
## Per sample mode enabled.
plotCounts(object, genes = genes, perSample = TRUE)


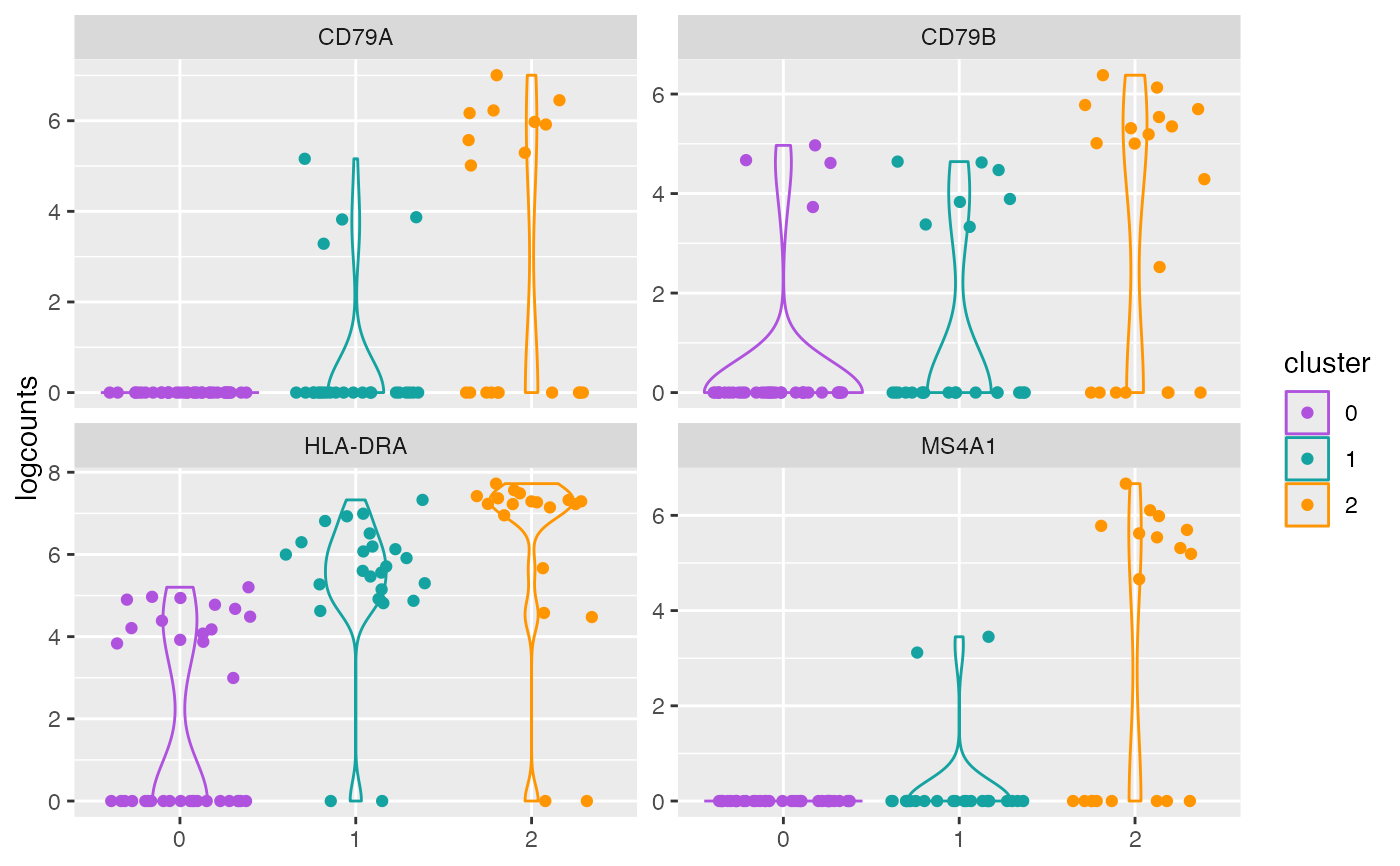
## Per sample mode disabled.
plotCounts(object, genes = genes, perSample = FALSE)
