Plot feature
Usage
plotFeature(object, ...)

# S4 method for class 'SingleCellExperiment'
plotFeature(
  object,
  features,
  reduction = "UMAP",
  color = getOption(x = "acid.continuous.color", default =
    ggplot2::scale_color_gradient(low = "gray75", high = "purple")),
  pointSize = getOption(x = "acid.point.size", default = 1L),
  pointAlpha = getOption(x = "acid.point.alpha", default = 0.9),
  pointsAsNumbers = getOption(x = "acid.points.as.numbers", default = FALSE),
  label = getOption(x = "acid.label", default = FALSE),
  labelSize = getOption(x = "acid.label.size", default = 6L),
  dark = getOption(x = "acid.dark", default = FALSE),
  legend = getOption(x = "acid.legend", default = TRUE),
  expression = c("mean", "sum")
)
Arguments
- object
Object.
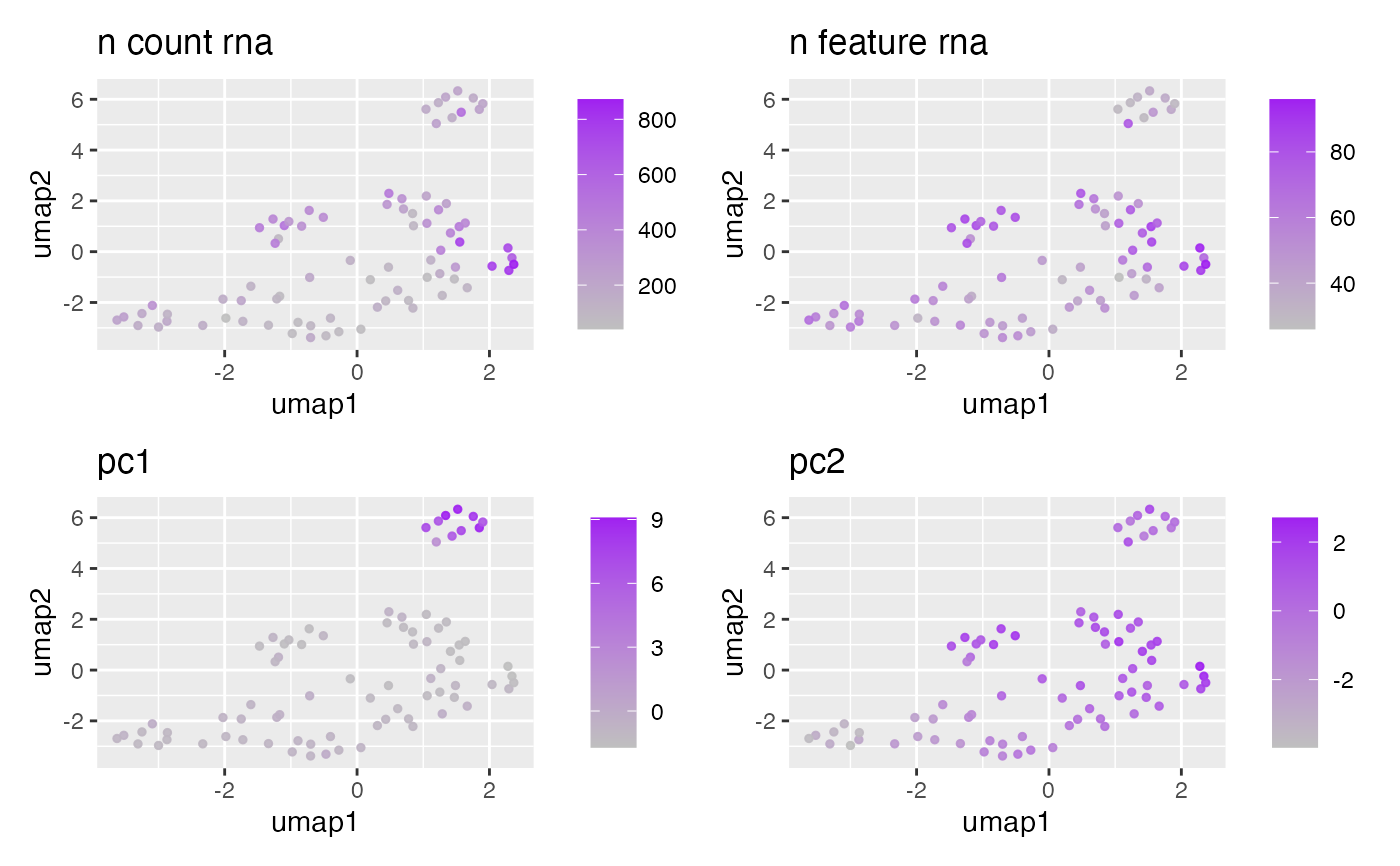
- features
character. Features to plot (e.g. gene expression, PC scores, number of genes detected).- reduction
vector(1). Dimension reduction name or index position.- color
ScaleDiscrete. Desired ggplot2 color scale. Must supply discrete values. When setNULL, the default ggplot2 color palette will be used. If manual color definitions are desired, we recommend usingggplot2::scale_color_manual().To set the discrete color palette globally, use:
- pointSize
numeric(1). Point size for dots in the plot. In the range of 1-3 is generally recommended.- pointAlpha
numeric(1)(0-1). Alpha transparency level.- pointsAsNumbers
logical(1). Plot the points as numbers (TRUE) or dots (FALSE).- label
logical(1). Superimpose sample text labels on the plot.- labelSize
integer(1). Size of the text label.- dark
logical(1). Plot against a dark background using theacid_theme_light()ggplot2 theme.- legend
logical(1). Include plot legend.- expression
character(1). Calculation to apply. Usesmatch.arg()internally and defaults to the first argument in thecharactervector.- ...
Additional arguments.