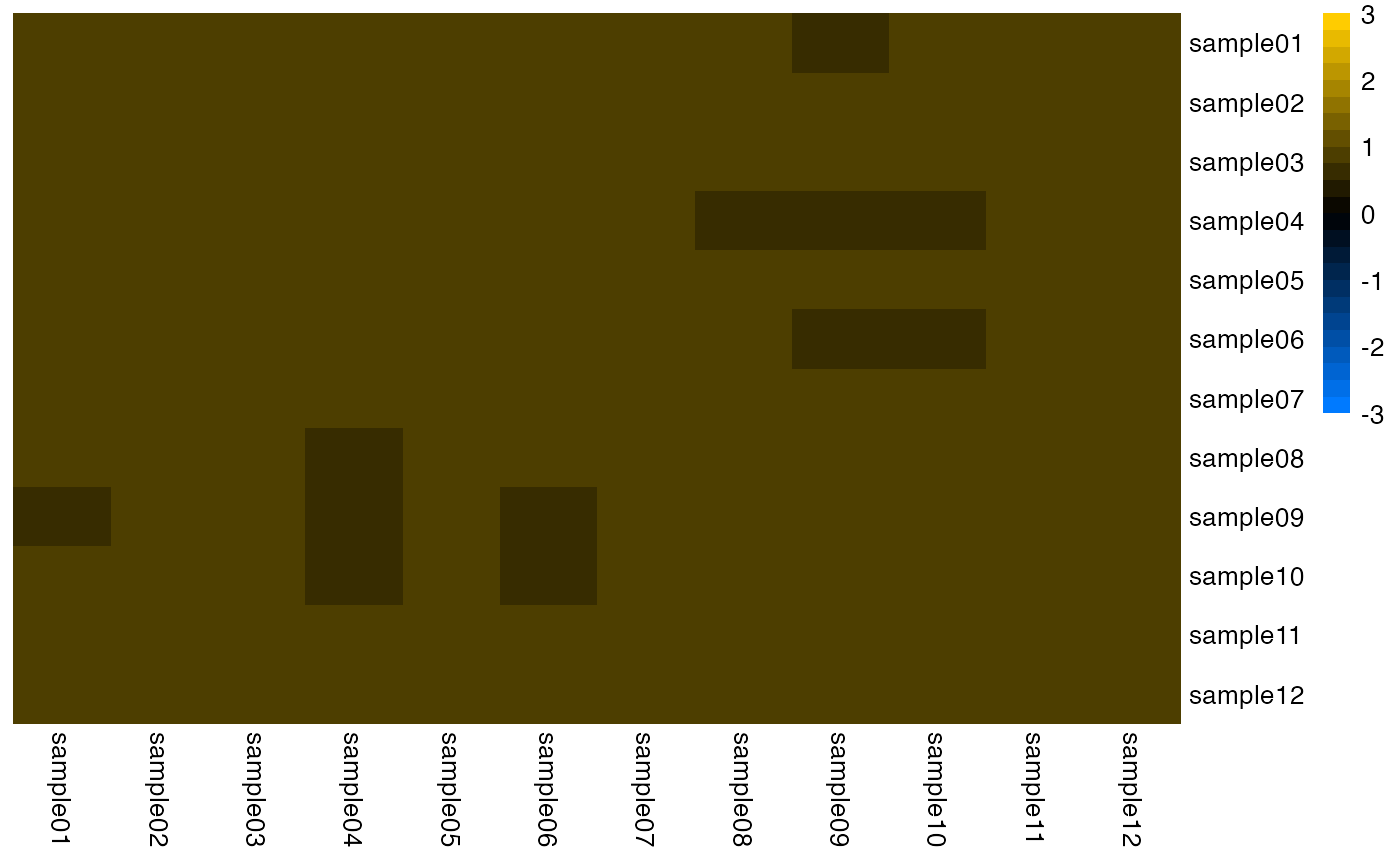
Plot counts correlation heatmap
Source:R/AllGenerics.R, R/plotCountsCorrelationHeatmap-methods.R
plotCountsCorrelationHeatmap.RdCompare feature expression correlation across two data sets.
Usage
plotCountsCorrelationHeatmap(x, y, ...)

# S4 method for class 'matrix,matrix'
plotCountsCorrelationHeatmap(x, y, i = NULL, j = NULL, method = "pearson", ...)
Arguments
- x
Object.
- y
Object.
- i
Indices specifying elements to extract or replace. Indices are
numericorcharactervectors, empty (missing), orNULL.For more information:
- j
Indices specifying elements to extract or replace. Indices are
numericorcharactervectors, empty (missing), orNULL.For more information:
- method
character(1). Correlation method. Refer tostats::cor()for details.- ...
Passthrough arguments to
plotHeatmap().