Plot enriched gene sets
Source:R/AllGenerics.R, R/plotEnrichedGeneSets-methods.R
plotEnrichedGeneSets.RdPlot enriched gene sets
Usage
plotEnrichedGeneSets(object, ...)

# S4 method for class 'FgseaList'
plotEnrichedGeneSets(
  object,
  collection,
  direction = c("both", "up", "down"),
  n = 10L,
  headerLevel = 3L
)
Arguments
- object
Object.
- collection
character(1). Gene set collection name. Typically refers toh(hallmark),c1-c7collections from MSigDb. Can obtain usingcollectionNames()onFgseaListobject.- direction
character(1). Include"both","up", or"down"directions.- n
integer(1). Number to include.- headerLevel
integer(1)(1-7). Markdown header level.- ...
Additional arguments.
Examples
data(fgsea)
## FgseaList ====
object <- fgsea
alphaThreshold(object) <- 0.9
collection <- collectionNames(object)[[1L]]
plotEnrichedGeneSets(
object = object,
collection = collection,
n = 1L
)
#>
#>
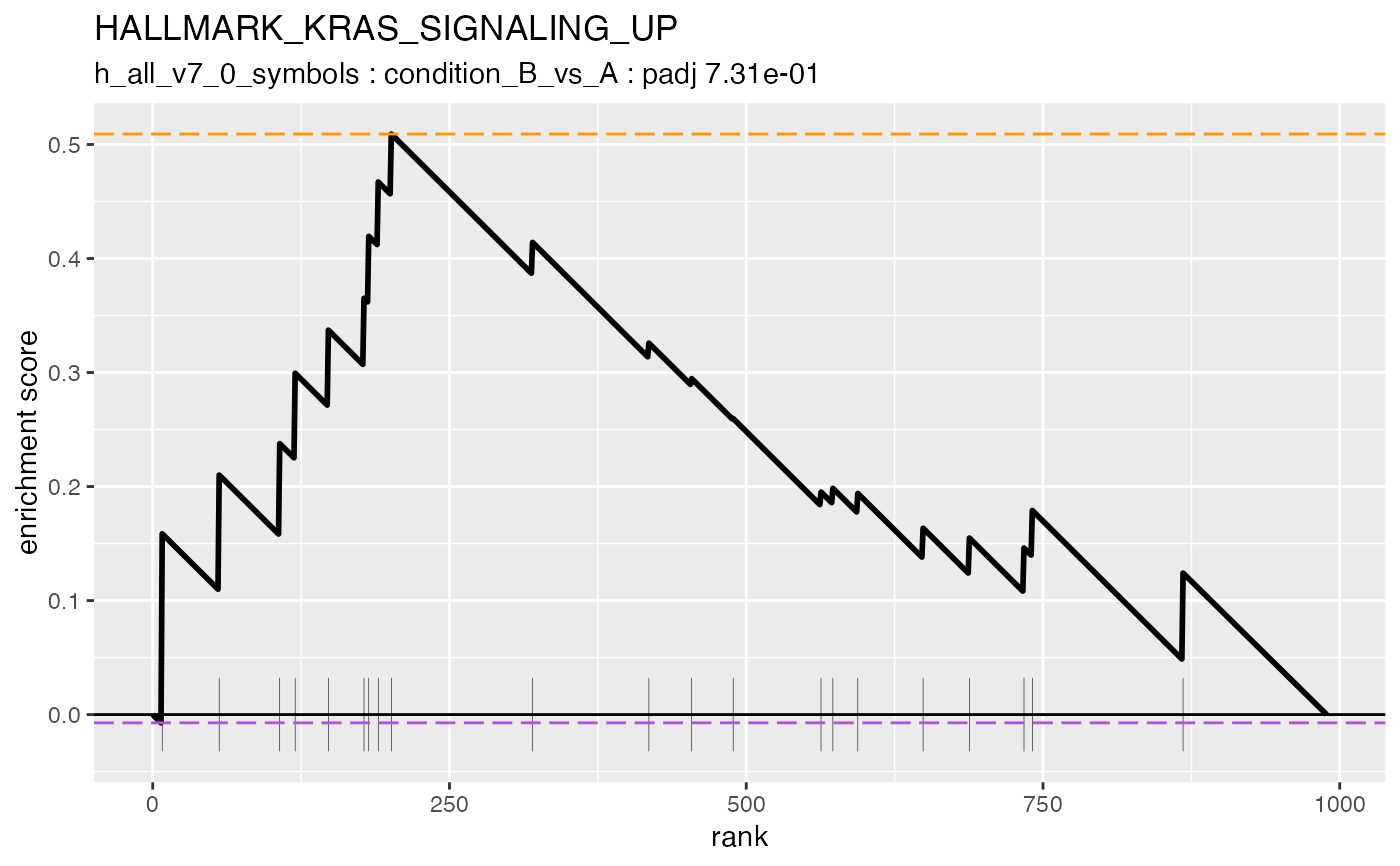
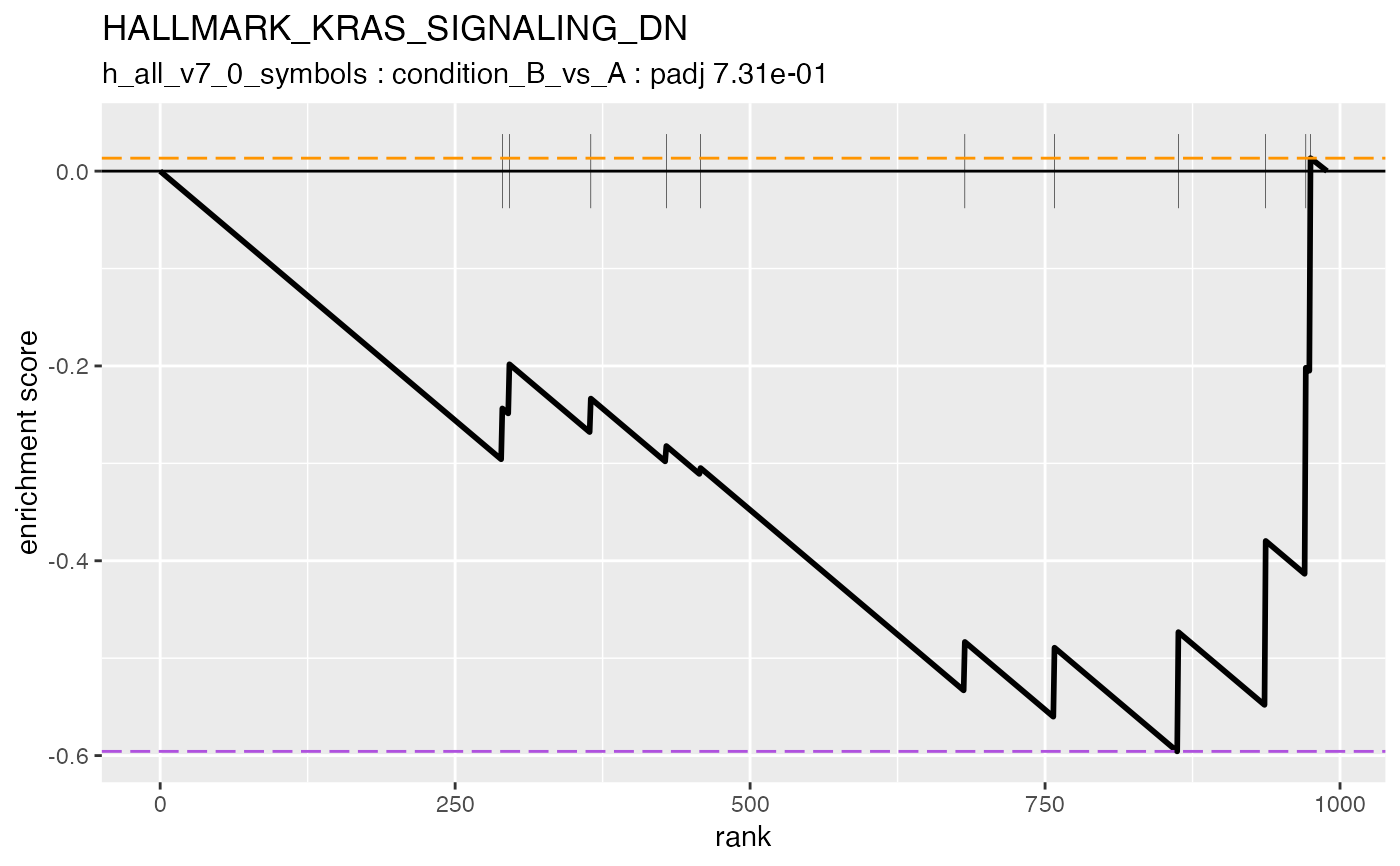
#> ### condition_B_vs_A {.tabset}
#>
#> ℹ 4 upregulated gene sets detected (alpha < 0.9; nes > 0).
#> ℹ 2 downregulated gene sets detected (alpha < 0.9; nes > 0).
#>
#>
#> #### HALLMARK_KRAS_SIGNALING_UP
#>
 #>
#>
#> #### HALLMARK_KRAS_SIGNALING_DN
#>
#>
#>
#> #### HALLMARK_KRAS_SIGNALING_DN
#>
 #>
#>
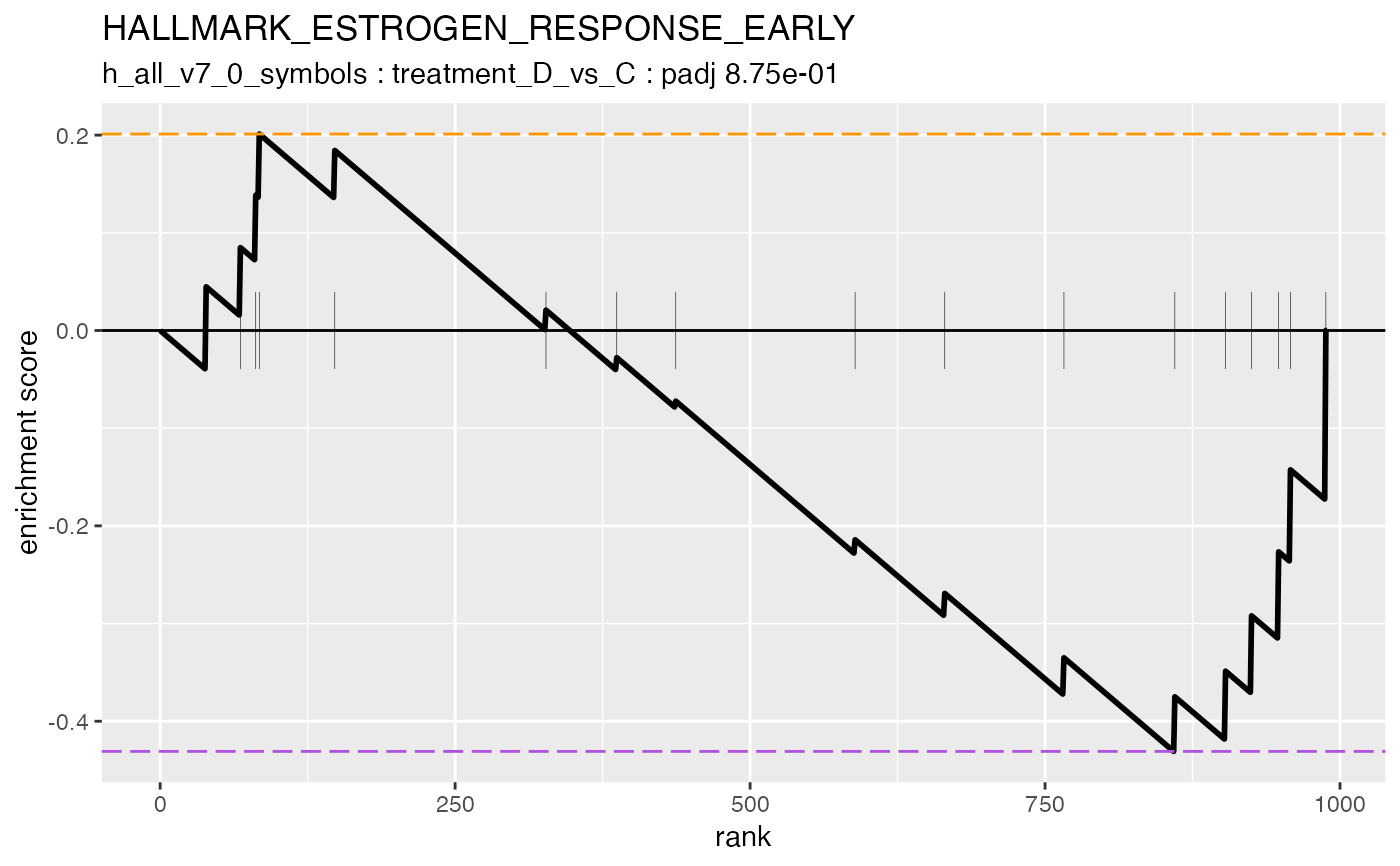
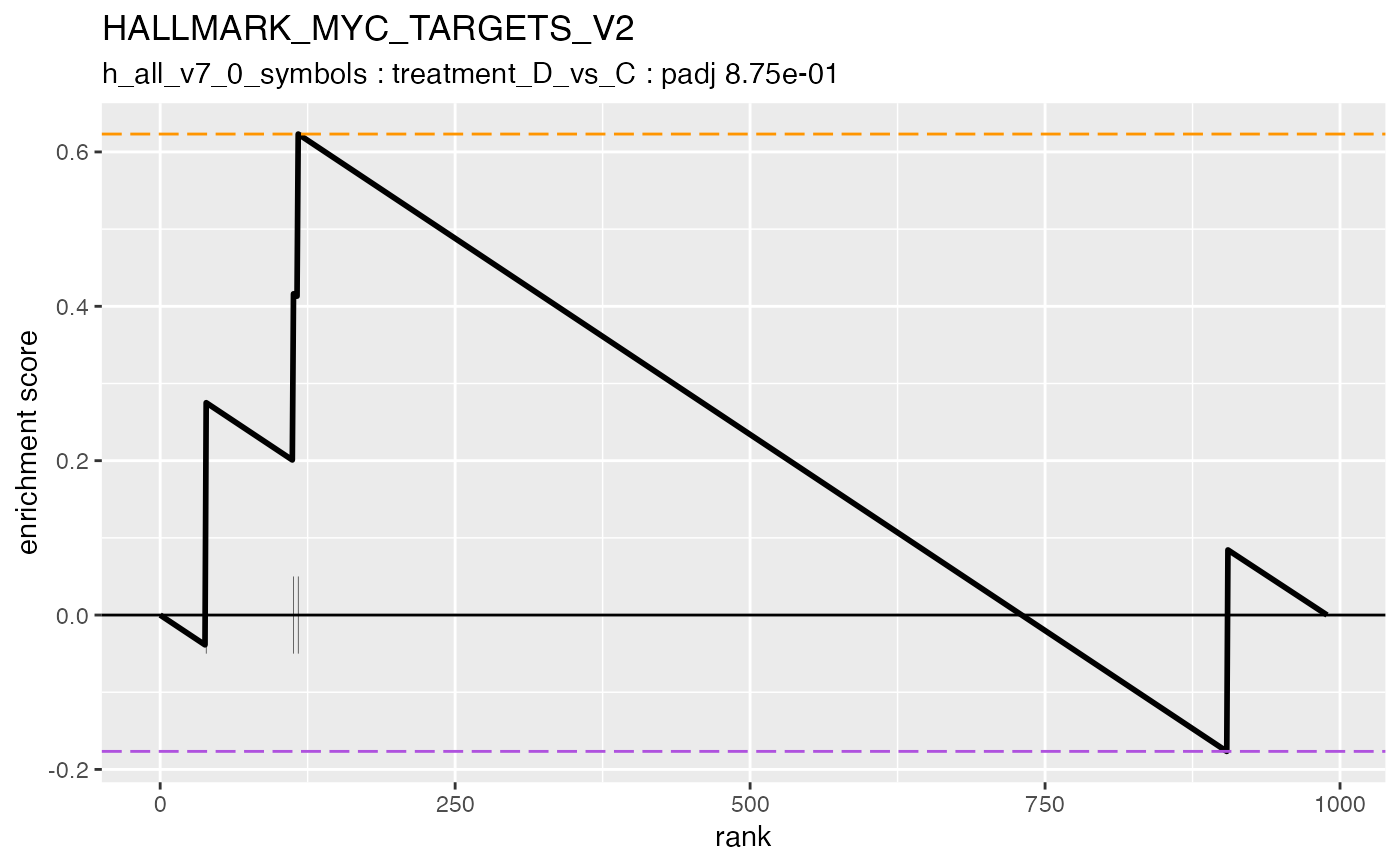
#> ### treatment_D_vs_C {.tabset}
#>
#> ℹ 23 upregulated gene sets detected (alpha < 0.9; nes > 0).
#> ℹ 12 downregulated gene sets detected (alpha < 0.9; nes > 0).
#>
#>
#> #### HALLMARK_MYC_TARGETS_V2
#>
#>
#>
#> ### treatment_D_vs_C {.tabset}
#>
#> ℹ 23 upregulated gene sets detected (alpha < 0.9; nes > 0).
#> ℹ 12 downregulated gene sets detected (alpha < 0.9; nes > 0).
#>
#>
#> #### HALLMARK_MYC_TARGETS_V2
#>
 #>
#>
#> #### HALLMARK_ESTROGEN_RESPONSE_EARLY
#>
#>
#>
#> #### HALLMARK_ESTROGEN_RESPONSE_EARLY
#>