Plot gene set enrichment
Usage
plotGeneSet(object, ...)

# S4 method for class 'FgseaList'
plotGeneSet(
  object,
  collection,
  contrast,
  set,
  colors = c(line = "black", min = AcidPlots::purpleOrange(n = 2L)[[1L]], max =
    AcidPlots::purpleOrange(n = 2L)[[2L]], ticks = "black", yintercept = "black")
)
Arguments
- object
Object.
- collection
character(1). Gene set collection name. Typically refers toh(hallmark),c1-c7collections from MSigDb. Can obtain usingcollectionNames()onFgseaListobject.- contrast
character(1). Contrast name.- set
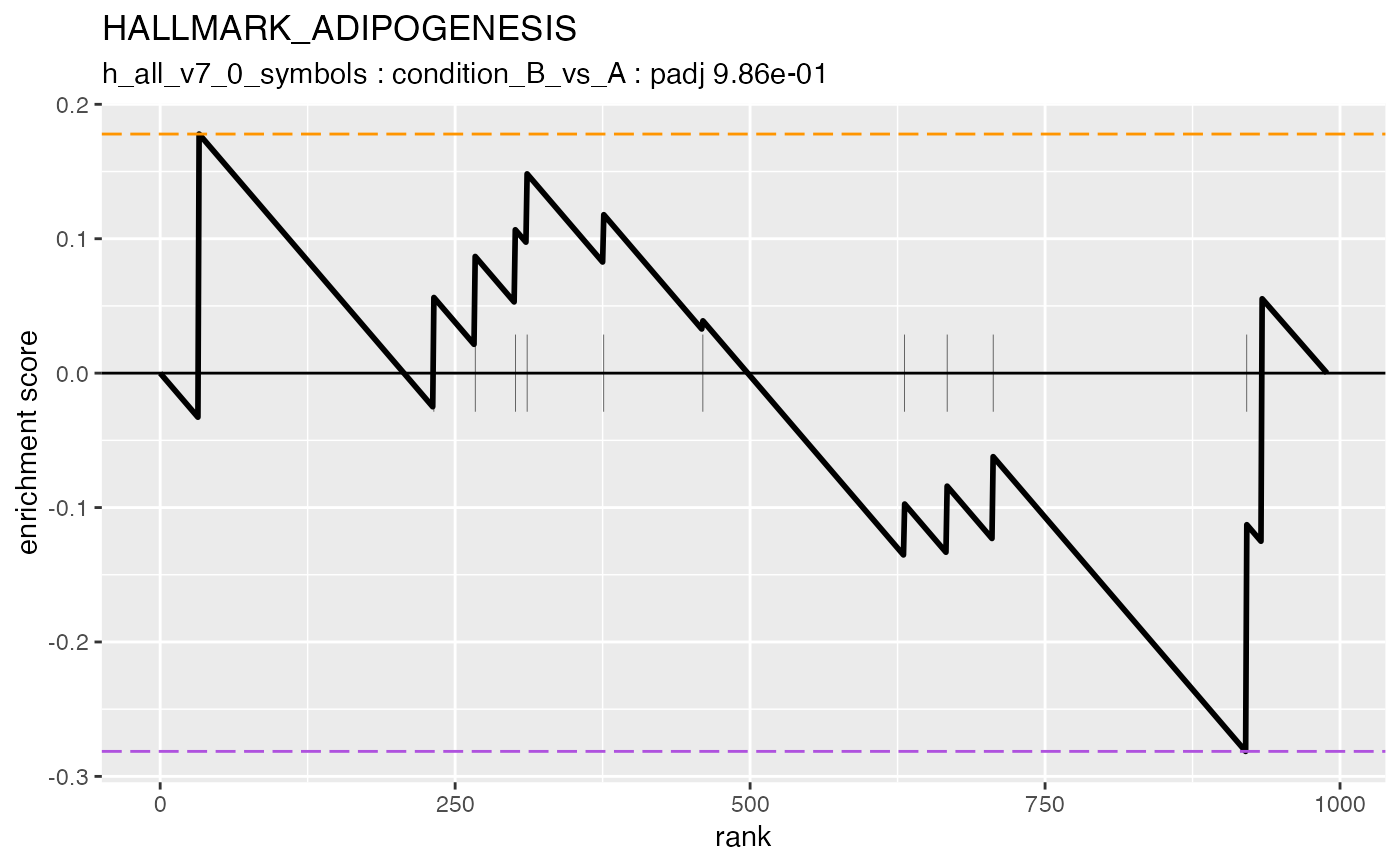
character(1). Gene set name, in a definedcollection. For example,"HALLMARK_ADIPOGENESIS".- colors
character(5). Named character color vector indicating:Line color.
Minimum (negative) threshold line color.
Maximum (positive) threhsold color.
Y intercept at origin color.
Ticks color.
- ...
Additional arguments.
See also
Modified version of fgsea::plotEnrichment().
Examples
data(fgsea)

## FgseaList ====
object <- fgsea
contrast <- contrastNames(object)[[1L]]
collection <- collectionNames(object)[[1L]]
set <- geneSetNames(object = object, collection = collection)[[1L]]
plotGeneSet(
    object = object,
    collection = collection,
    contrast = contrast,
    set = set
)