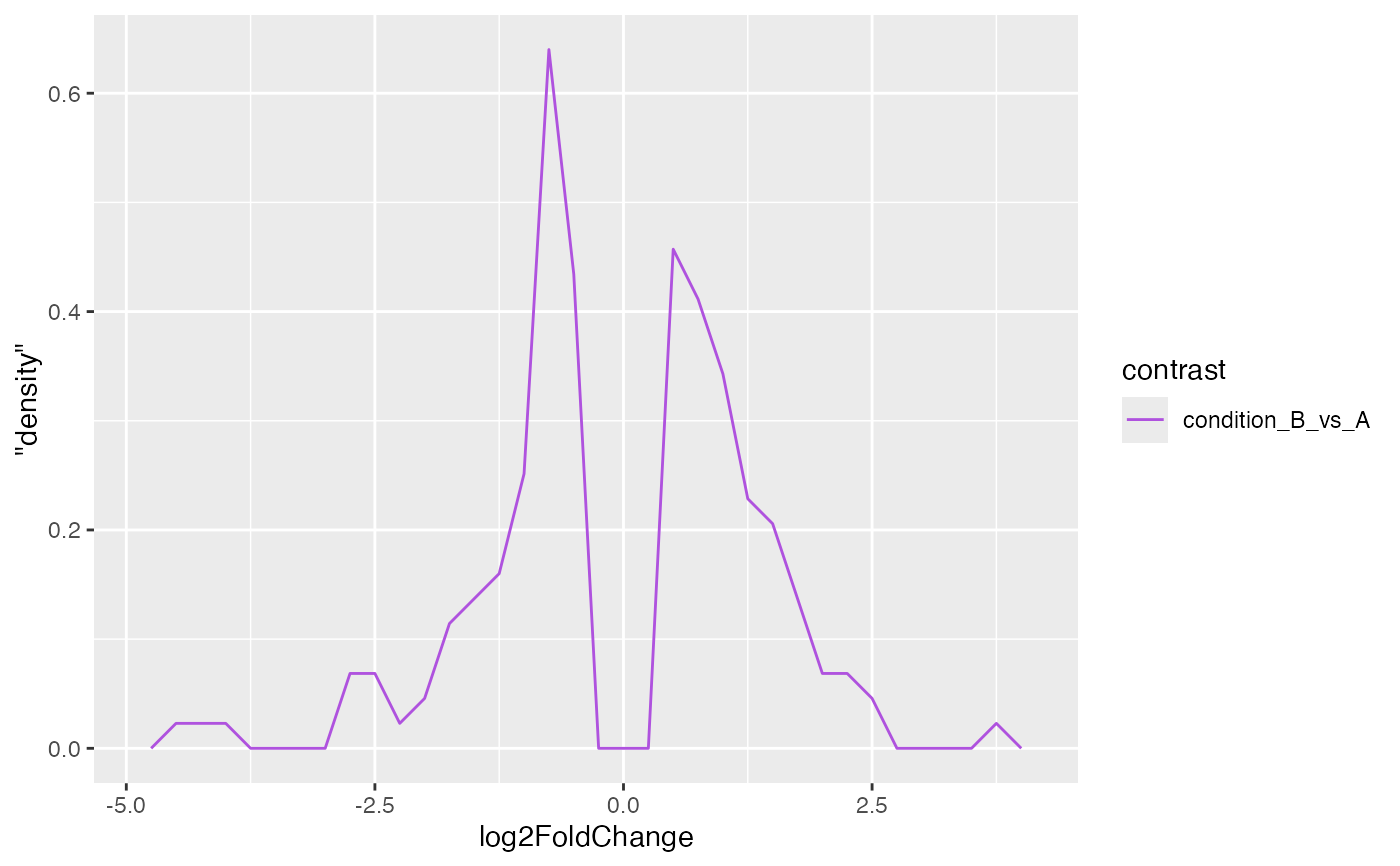
Plot log2 fold change distributions
Examples
data(deseq)

## DESeqAnalysis ====
object <- deseq
lfcThreshold(object) <- 0.5
plotLfc(object)
Plot log2 fold change distributions
data(deseq)
## DESeqAnalysis ====
object <- deseq
lfcThreshold(object) <- 0.5
plotLfc(object)