Plot the distribution of read counts for all unfiltered cellular barcodes.
Usage
plotReadsPerCell(object, ...)

# S4 method for bcbioSingleCell
plotReadsPerCell(
  object,
  interestingGroups = NULL,
  geom = c("histogram", "ecdf", "violin", "ridgeline", "boxplot"),
  cutoffLine = FALSE,
  title = "Reads per cell"
)
Arguments
- object
Object.
- interestingGroups
character. Groups of interest to use for visualization. Corresponds to factors describing the columns of the object.- geom
character(1). Plot type. Usesmatch.arg()internally and defaults to the first argument in thecharactervector.- cutoffLine
logical(1). Include a line marking the cutoff.- title
character(1). Title.- ...
Additional arguments.
Examples
data(bcb)
## bcbioSingleCell ====
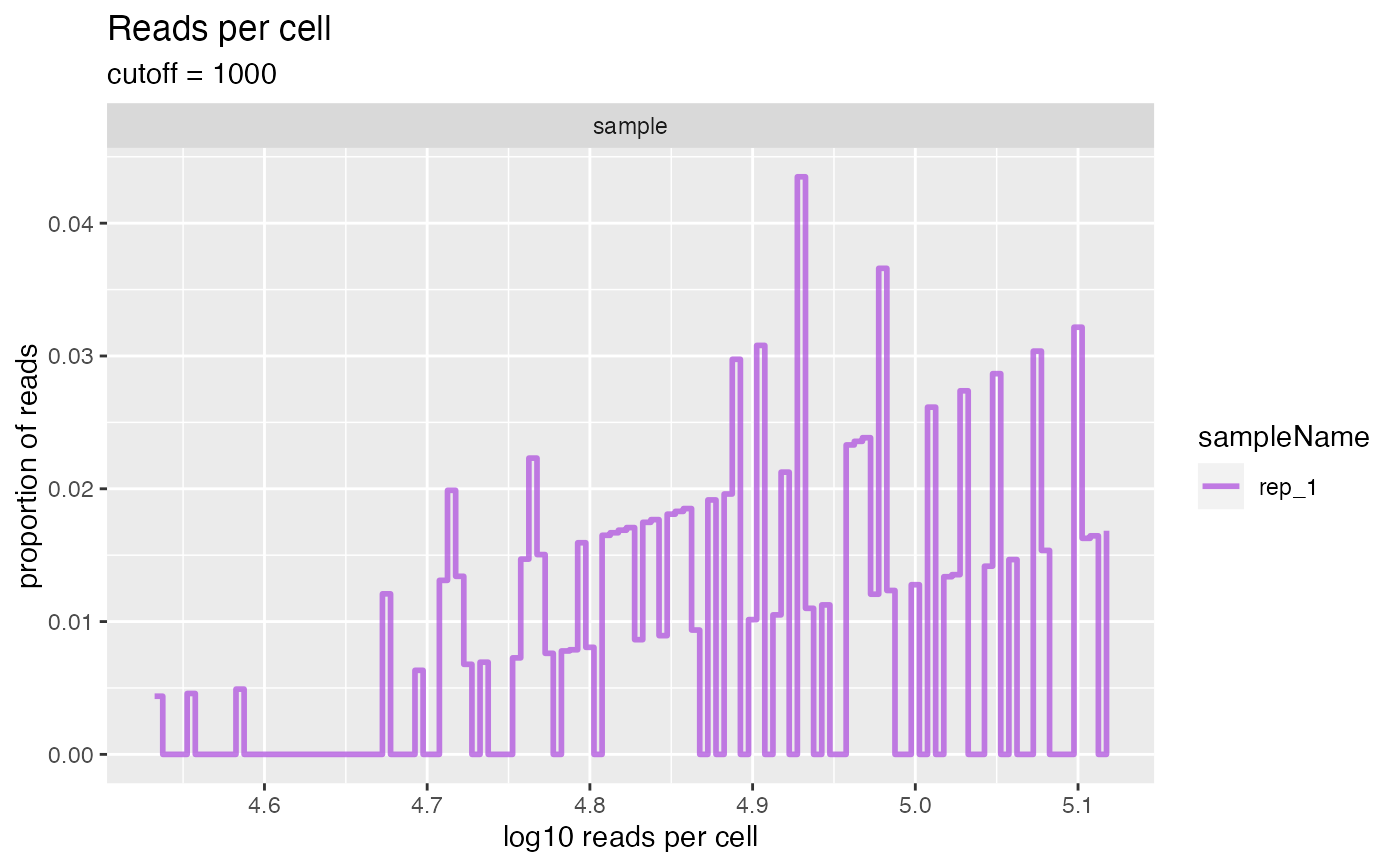
plotReadsPerCell(bcb, geom = "histogram")
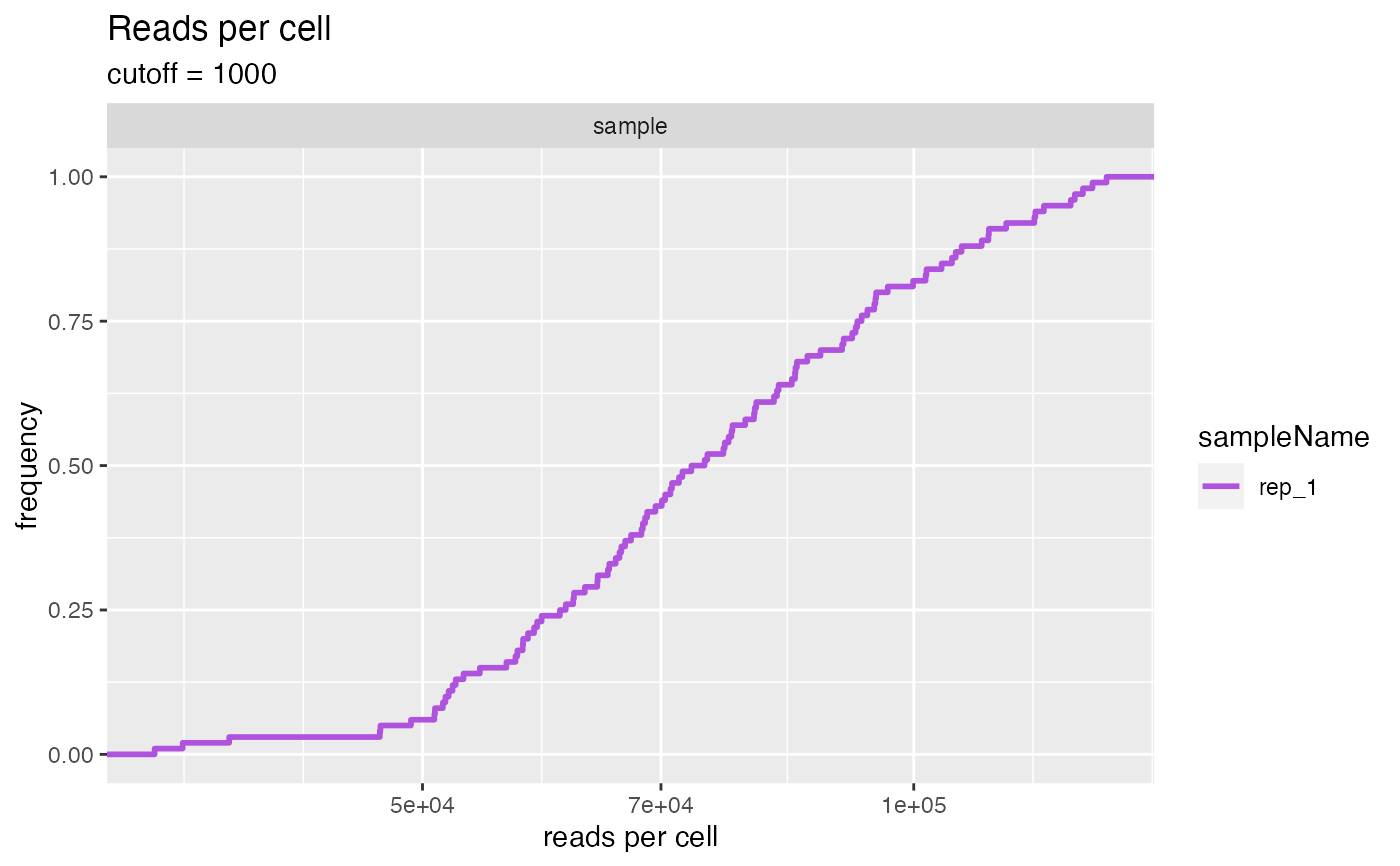
 plotReadsPerCell(bcb, geom = "ecdf")