Plot pseudo vs. aligned counts
Source:R/AllGenerics.R, R/plotPseudoVsAlignedCounts-methods.R
plotPseudoVsAlignedCounts.RdPlot pseudo vs. aligned counts
Usage
plotPseudoVsAlignedCounts(object, ...)

# S4 method for bcbioRNASeq
plotPseudoVsAlignedCounts(
  object,
  genes = NULL,
  title = "Pseudoaligned vs. aligned counts",
  ...
)
Arguments
- object
Object.
- genes
character. Gene identifiers.- title
character(1). Title.- ...
Passthrough to
AcidPlots::plotCountsCorrelationHeatmap()whengenes = NULLorAcidPlots::plotCountsCorrelation()whengenesare defined.
Note
Updated 2023-10-05.
Currently supported for salmon or kallisto. The function will
intentionally error for datasets containing aligned counts in the primary
counts assay.
Examples
data(bcb)
## bcbioRNASeq ====
## Correlation heatmap.
plotPseudoVsAlignedCounts(bcb)
#> ! Censoring 29 genes containing an NA value.
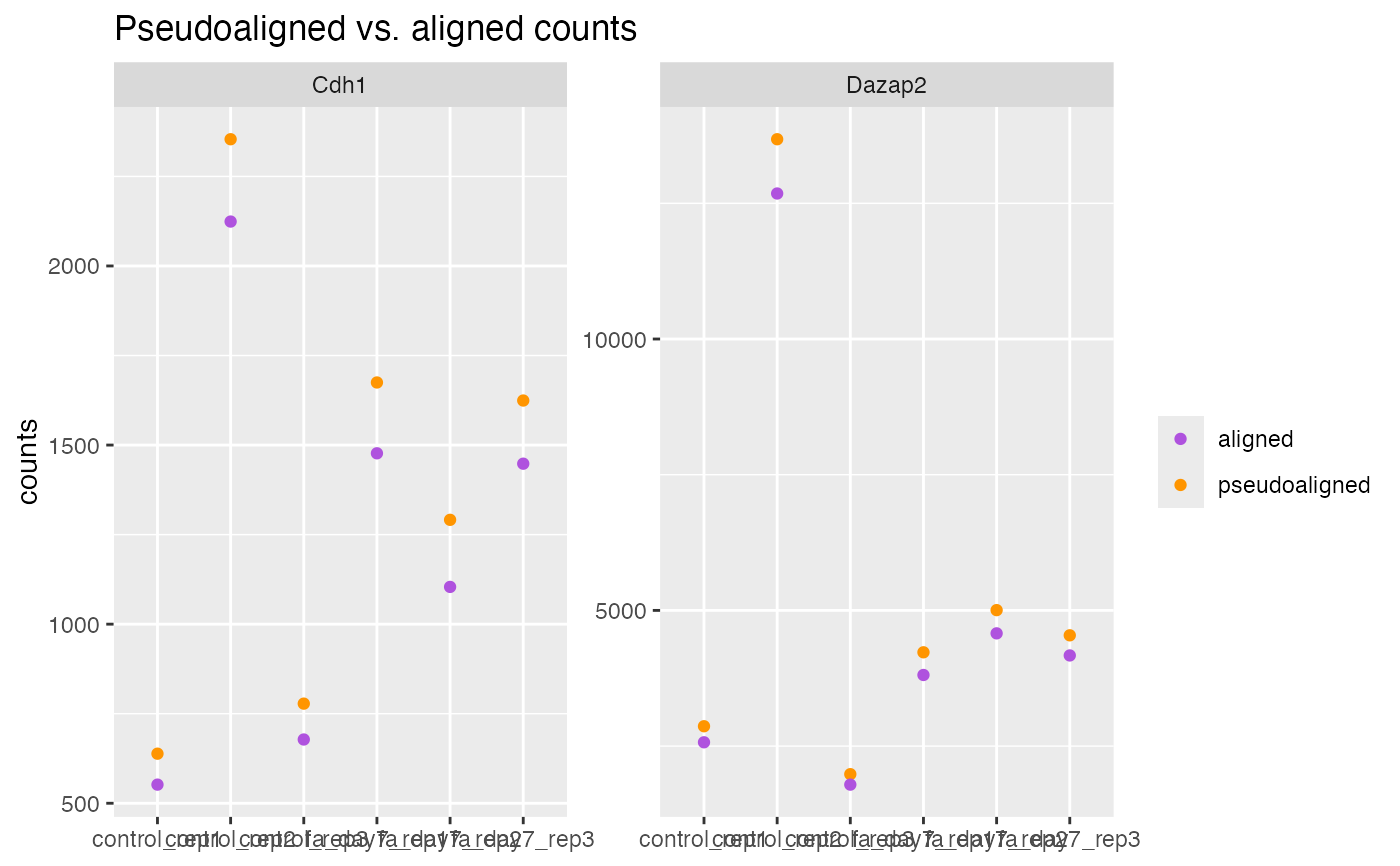
 ## Individual genes.
## Checking the most expressed aligned genes here.
aligned <- SummarizedExperiment::assay(bcb, i = "aligned")
genes <- names(tail(sort(rowSums(aligned)), n = 2L))
plotPseudoVsAlignedCounts(bcb, genes = genes)
## Individual genes.
## Checking the most expressed aligned genes here.
aligned <- SummarizedExperiment::assay(bcb, i = "aligned")
genes <- names(tail(sort(rowSums(aligned)), n = 2L))
plotPseudoVsAlignedCounts(bcb, genes = genes)