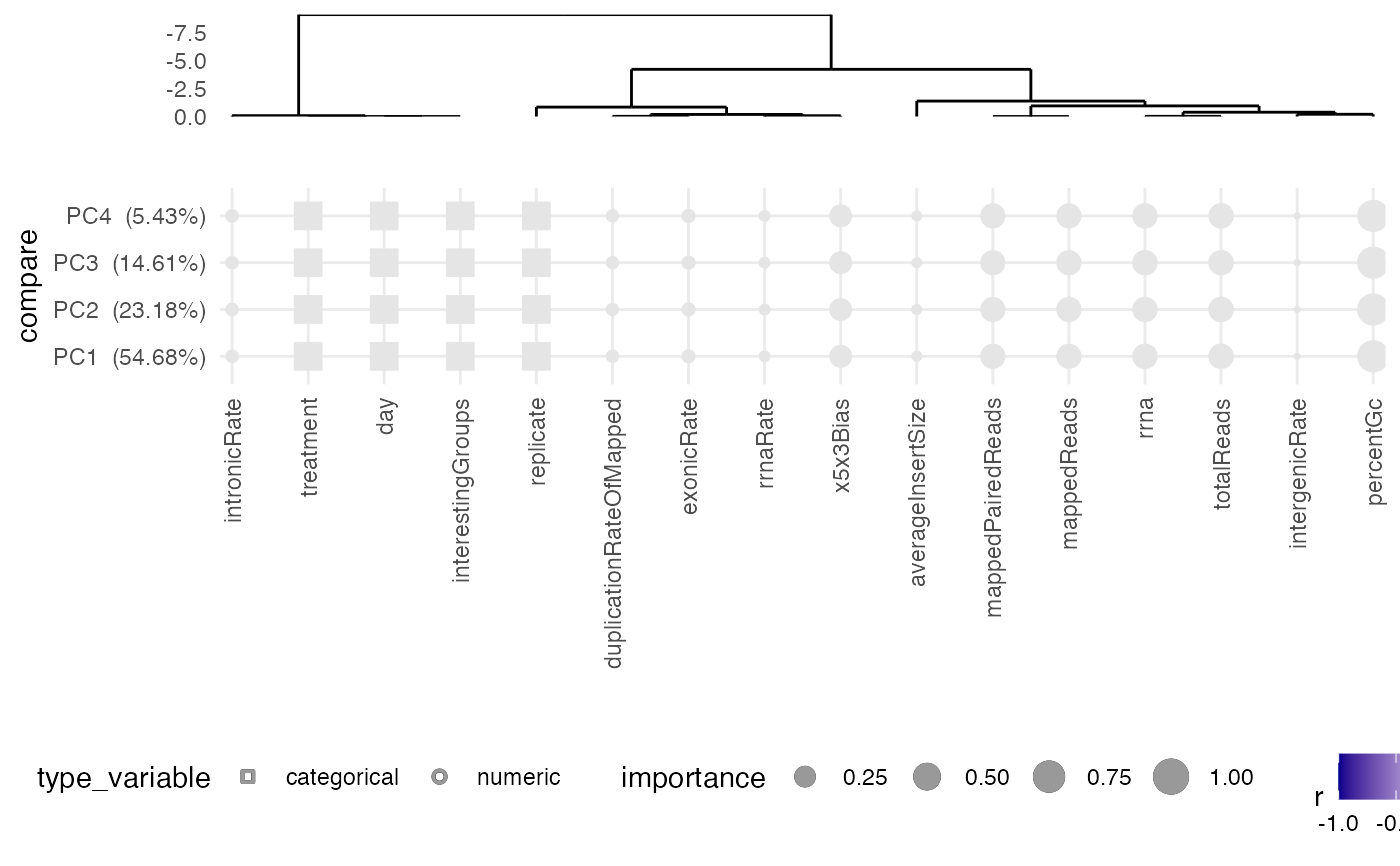
Find correlation between principal components (PCs) and covariates
Source:R/AllGenerics.R, R/plotPcaCovariates-methods.R
plotPcaCovariates.RdFind correlation between principal components (PCs) and covariates
Usage
plotPcaCovariates(object, ...)

# S4 method for bcbioRNASeq
plotPcaCovariates(
  object,
  metrics = TRUE,
  normalized = c("tpm", "sf", "fpkm", "vst", "rlog", "tmm", "rle"),
  fdr = 0.1
)
Arguments
- object
Object.
- metrics
boolean. Include sample summary metrics as covariates. Defaults to include all metrics columns (TRUE), but desired columns can be specified here as a character vector.- normalized
character(1)orlogical(1). Normalization method to apply:FALSE: Raw counts. When using a tximport-compatible caller, these are length scaled by default (seecountsFromAbundanceargument). When using a featureCounts-compatible caller, these areinteger.
tximport caller-specific normalizations:
"tpm": Transcripts per million.
Additional gene-level-specific normalizations:
TRUE/"sf": Size factor (i.e. library size) normalized counts.
SeeDESeq2::sizeFactorsfor details."fpkm": Fragments per kilobase per million mapped fragments.
Requiresfast = FALSEinbcbioRNASeq()call and gene annotations inrowRanges()with definedwidth().
SeeDESeq2::fpkm()for details."vst": Variance-stabilizing transformation (log2).
Requiresfast = FALSEto be set duringbcbioRNASeq()call.
SeeDESeq2::varianceStabilizingTransformation()for more information."tmm": Trimmed mean of M-values.
Calculated on the fly.
SeeedgeR::calcNormFactors()for details."rle": Relative log expression transformation.
Calculated on the fly.
SeerelativeLogExpression()for details."rlog": Deprecated. Regularized log transformation (log2).
No longer calculated automatically duringbcbioRNASeq()call, but may be defined in legacy objects.
SeeDESeq2::rlog()for details.
Note that VST is more performant and now recommended by default instead.
Note that
logical(1)support only applies tocounts(). Other functions in the package requirecharacter(1)and usematch.arg()internally.- fdr
numeric(1). Cutoff to determine the minimum false discovery rate (FDR) to consider significant correlations between principal components (PCs) and covariates.- ...
Additional arguments, passed to
DEGreport::degCovariates().
Examples
data(bcb)

## bcbioRNASeq ====
if (requireNamespace("DEGreport", quietly = TRUE)) {
    plotPcaCovariates(bcb)
}
#>
#> running pca and calculating correlations for:
#> un-scaled  data in pca;
#> pve >= 5%;
#> kendall cor