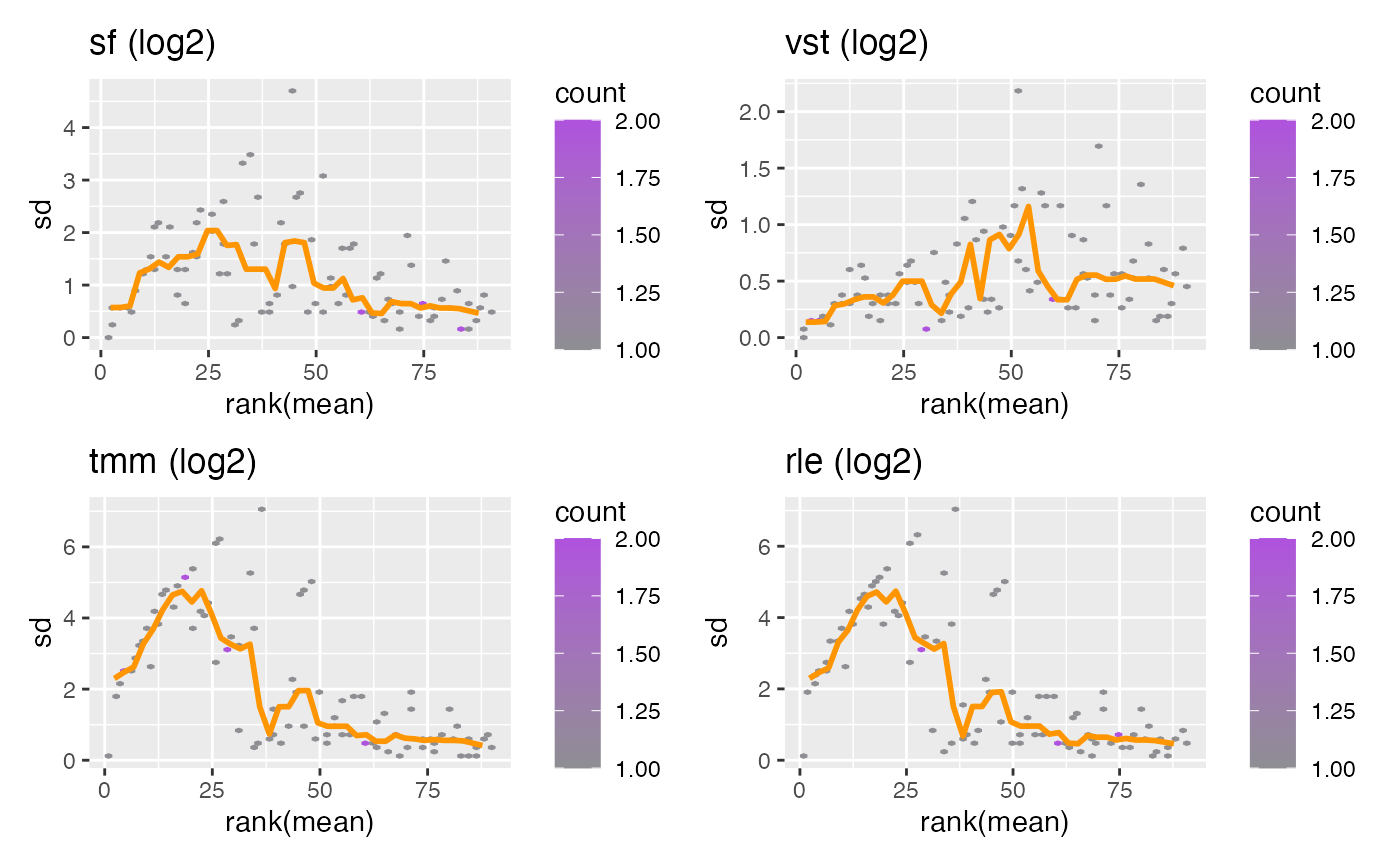
Plot row standard deviations vs. row means
Source:R/AllGenerics.R, R/plotMeanSd-methods.R
plotMeanSd.RdPlot row standard deviations vs. row means
Usage
plotMeanSd(object, ...)

# S4 method for bcbioRNASeq
plotMeanSd(
  object,
  fill = ggplot2::scale_fill_gradient(low = AcidPlots::lightPalette[["gray"]], high =
    AcidPlots::lightPalette[["purple"]]),
  lineColor = AcidPlots::lightPalette[["orange"]],
  legend = getOption(x = "acid.legend", default = TRUE)
)
Arguments
- object
Object.
- fill
ggproto/ScaleDiscrete. Desired ggplot2 fill scale. Must supply discrete values. When set toNULL, the default ggplot2 color palette will be used. If manual color definitions are desired, we recommend usingggplot2::scale_fill_manual().To set the discrete fill palette globally, use:
- lineColor
character(1). Line color.- legend
logical(1). Include plot legend.- ...
Additional arguments.
Details
vsn::meanSdPlot() wrapper that plots count transformations on a log2 scale.
DESeq2 log2: log2 library size factor-adjusted normalized counts.
DESeq2 rlog: regularized log transformation.
DESeq2 VST: variance-stabilizing transformation.
edgeR log2 TMM: log2 trimmed mean of M-values transformation.
Examples
data(bcb)

## bcbioRNASeq ====
if (requireNamespace("vsn", quietly = TRUE)) {
    plotMeanSd(bcb)
}
