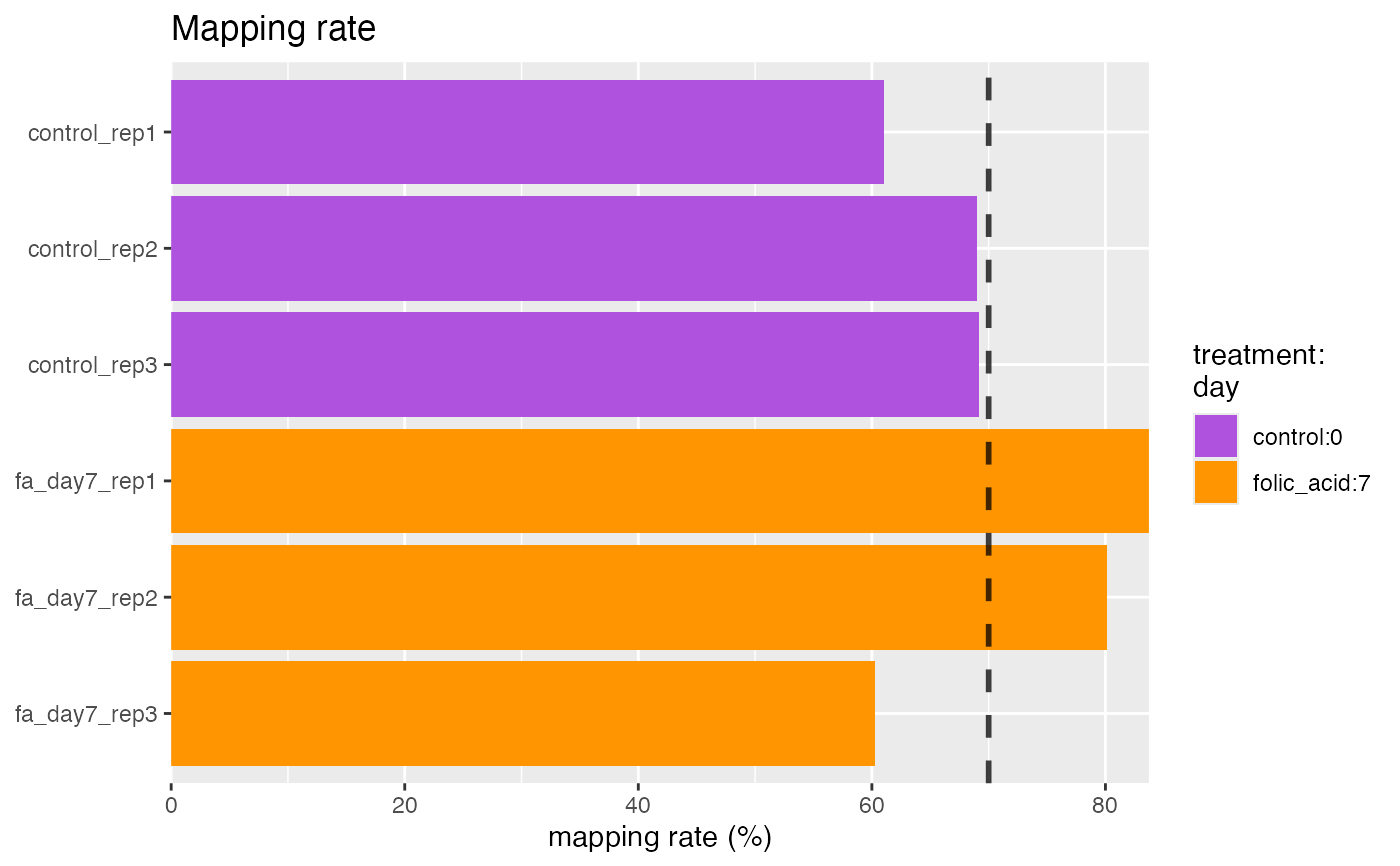
The genomic mapping rate represents the percentage of reads mapping to the reference genome. Low mapping rates are indicative of sample contamination, poor sequencing quality or other artifacts.
Arguments
- object
Object.
- interestingGroups
character. Groups of interest to use for visualization. Corresponds to factors describing the columns of the object.- limit
numeric(1). Threshold limit.- labels
list. ggplot2 labels. Seeggplot2::labs()for details.- flip
logical(1). Flip x and y axes. Recommended for plots containing many samples.- ...
Additional arguments.
Examples
data(bcb)

## bcbioRNASeq ====
plotMappingRate(bcb)