Plot exonic mapping rate
Source:R/AllGenerics.R, R/plotExonicMappingRate-methods.R
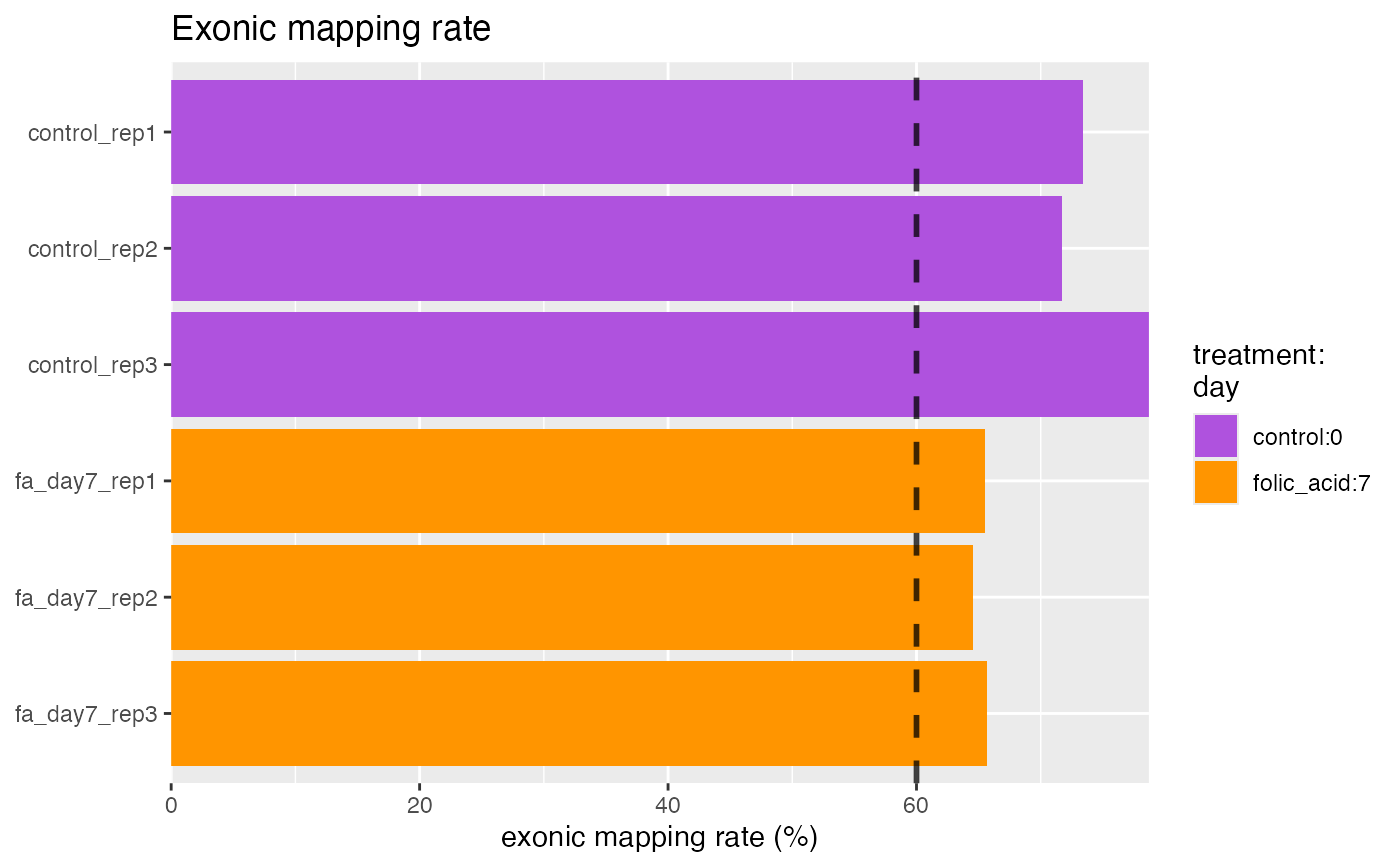
plotExonicMappingRate.RdIdeally, at least 60 percent of total reads should map to exons for RNA-seq.
Usage
plotExonicMappingRate(object, ...)

# S4 method for bcbioRNASeq
plotExonicMappingRate(
  object,
  interestingGroups = NULL,
  limit = 0.6,
  labels = list(title = "Exonic mapping rate", subtitle = NULL, sampleAxis = NULL,
    metricAxis = "exonic mapping rate (%)"),
  flip = getOption(x = "acid.flip", default = TRUE)
)
Arguments
- object
Object.
- interestingGroups
character. Groups of interest to use for visualization. Corresponds to factors describing the columns of the object.- limit
numeric(1). Threshold limit.- labels
list. ggplot2 labels. Seeggplot2::labs()for details.- flip
logical(1). Flip x and y axes. Recommended for plots containing many samples.- ...
Additional arguments.
Examples
data(bcb)

## bcbioRNASeq ====
plotExonicMappingRate(bcb)