Plot dispersion estimates
Arguments
- object
Object.
- ...
Passthrough to
DESeqDataSetmethod defined in DESeq2. SeeDESeq2::plotDispEsts()for details.
Details
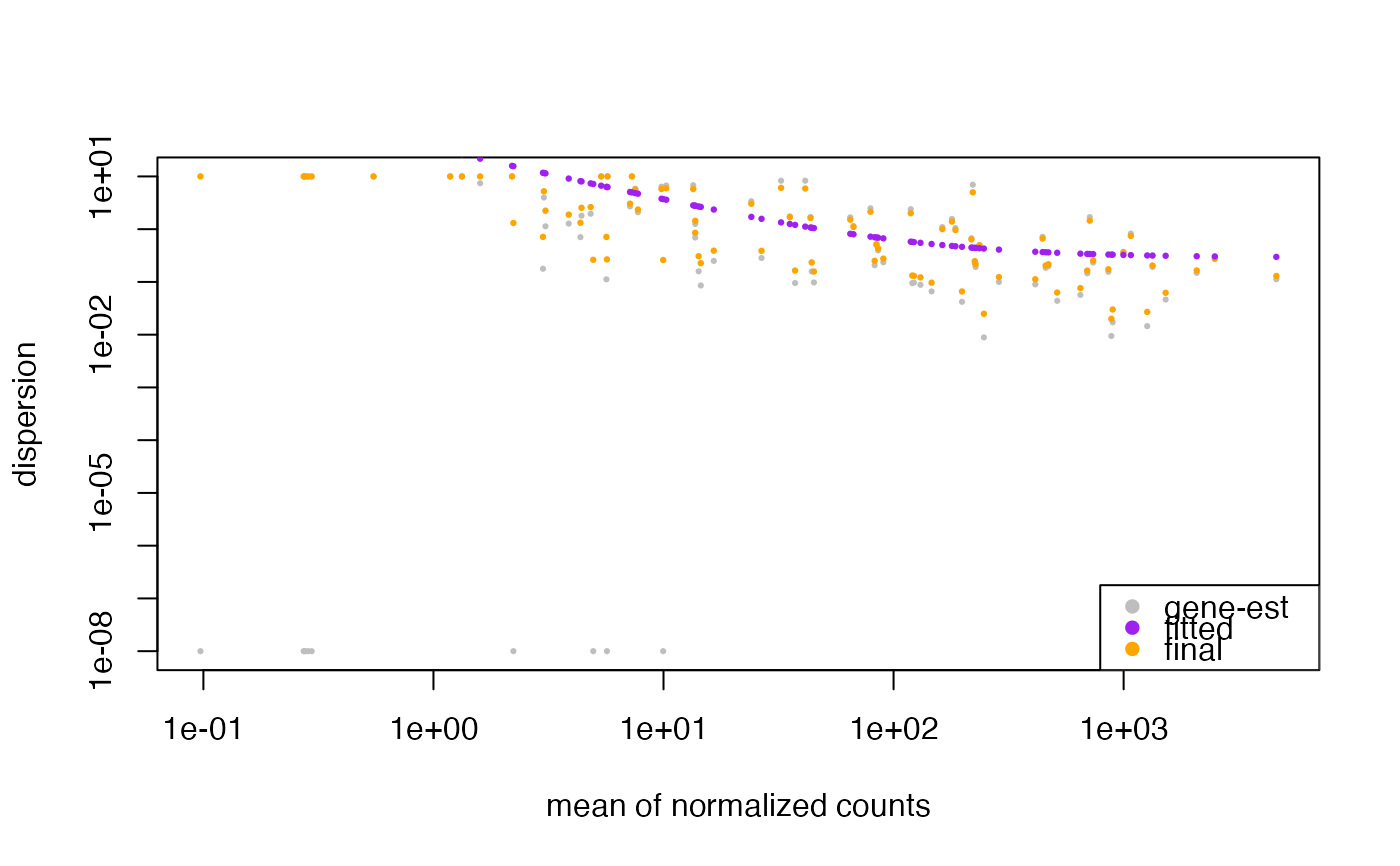
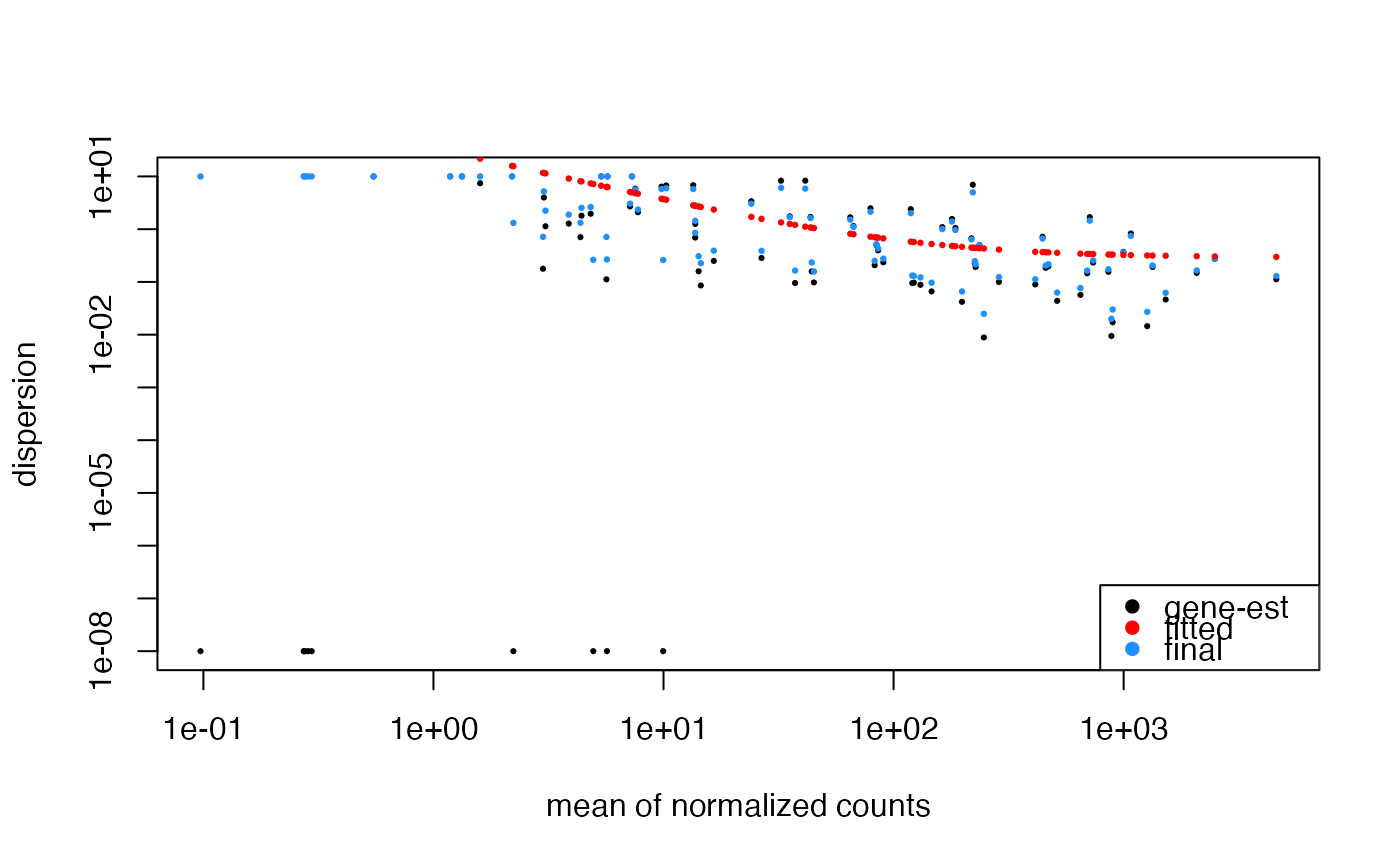
This plot shows the dispersion by mean of normalized counts. We expect the dispersion to decrease as the mean of normalized counts increases.
Here we're generating a DESeqDataSet object on the fly, which already has
method support for plotting dispersion, provided by the DESeq2 package.
Examples
data(bcb)

## bcbioRNASeq ====
plotDispEsts(bcb)
#> estimating size factors
#> estimating dispersions
#> gene-wise dispersion estimates
#> mean-dispersion relationship
#> final dispersion estimates
#> fitting model and testing


## Custom colors, using DESeq2 parameters.
plotDispEsts(
    object = bcb,
    genecol = "gray",
    fitcol = "purple",
    finalcol = "orange"
)
#> estimating size factors
#> estimating dispersions
#> gene-wise dispersion estimates
#> mean-dispersion relationship
#> final dispersion estimates
#> fitting model and testing
## Custom colors, using DESeq2 parameters.
plotDispEsts(
object = bcb,
genecol = "gray",
fitcol = "purple",
finalcol = "orange"
)
#> estimating size factors
#> estimating dispersions
#> gene-wise dispersion estimates
#> mean-dispersion relationship
#> final dispersion estimates
#> fitting model and testing