Correlation heatmap
Source:R/AllGenerics.R, R/plotCorrelationHeatmap-methods.R
plotCorrelationHeatmap.RdCorrelation heatmap
Usage
plotCorrelationHeatmap(object, ...)

# S4 method for bcbioRNASeq
plotCorrelationHeatmap(object, normalized = c("vst", "rlog"), ...)
Arguments
- object
Object.
- normalized
character(1)orlogical(1). Normalization method to apply:FALSE: Raw counts. When using a tximport-compatible caller, these are length scaled by default (seecountsFromAbundanceargument). When using a featureCounts-compatible caller, these areinteger.
tximport caller-specific normalizations:
"tpm": Transcripts per million.
Additional gene-level-specific normalizations:
TRUE/"sf": Size factor (i.e. library size) normalized counts.
SeeDESeq2::sizeFactorsfor details."fpkm": Fragments per kilobase per million mapped fragments.
Requiresfast = FALSEinbcbioRNASeq()call and gene annotations inrowRanges()with definedwidth().
SeeDESeq2::fpkm()for details."vst": Variance-stabilizing transformation (log2).
Requiresfast = FALSEto be set duringbcbioRNASeq()call.
SeeDESeq2::varianceStabilizingTransformation()for more information."tmm": Trimmed mean of M-values.
Calculated on the fly.
SeeedgeR::calcNormFactors()for details."rle": Relative log expression transformation.
Calculated on the fly.
SeerelativeLogExpression()for details."rlog": Deprecated. Regularized log transformation (log2).
No longer calculated automatically duringbcbioRNASeq()call, but may be defined in legacy objects.
SeeDESeq2::rlog()for details.
Note that VST is more performant and now recommended by default instead.
Note that
logical(1)support only applies tocounts(). Other functions in the package requirecharacter(1)and usematch.arg()internally.- ...
Passthrough to
SummarizedExperimentmethod defined in AcidPlots. SeeAcidPlots::plotCorrelationHeatmap()for details.
Examples
data(bcb)
## bcbioRNASeq ====
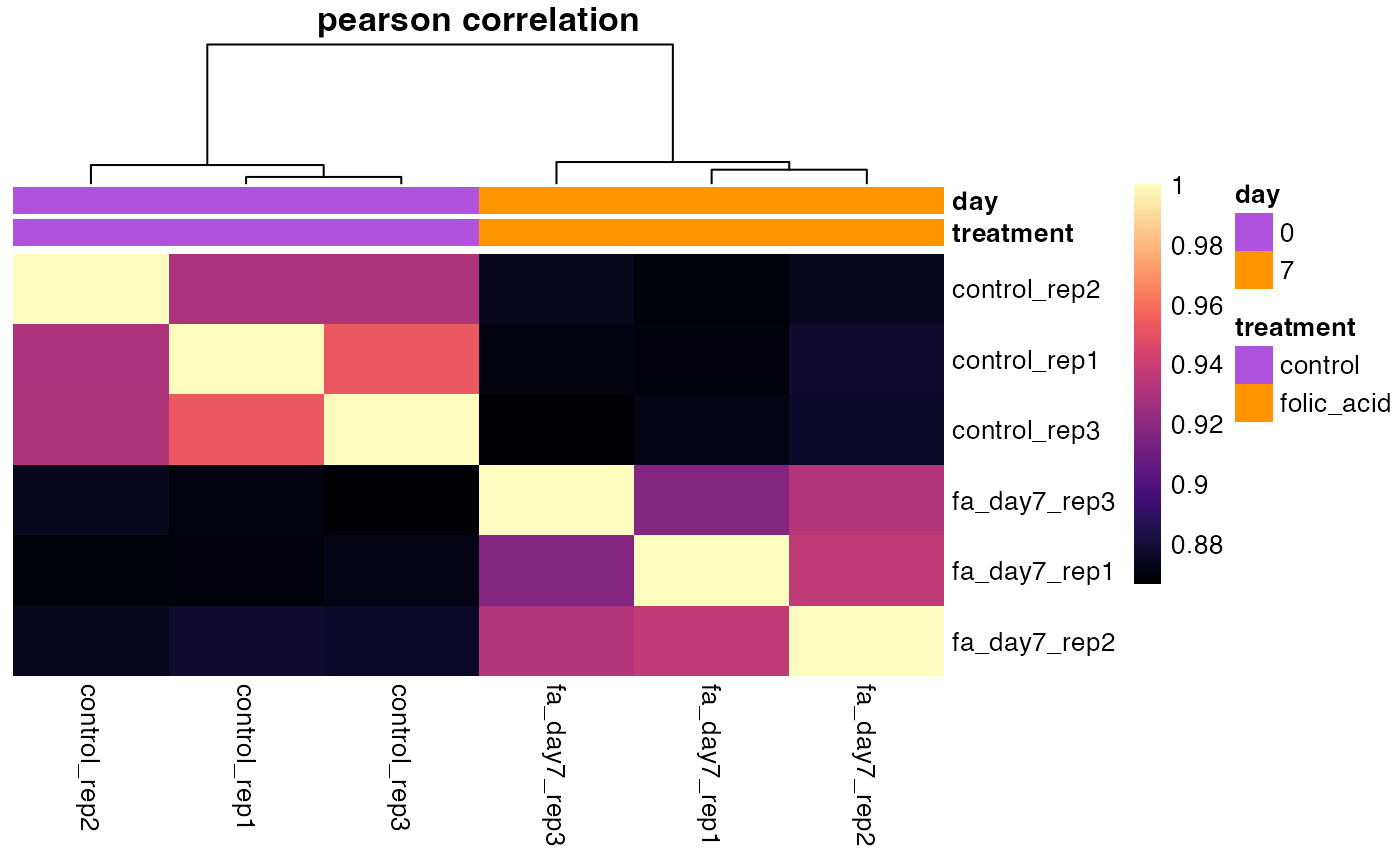
plotCorrelationHeatmap(bcb, method = "pearson")
#> ℹ Using "vst" counts.
#> → Calculating correlation matrix using `pearson` method.
 plotCorrelationHeatmap(bcb, method = "spearman")
#> ℹ Using "vst" counts.
#> → Calculating correlation matrix using `spearman` method.
plotCorrelationHeatmap(bcb, method = "spearman")
#> ℹ Using "vst" counts.
#> → Calculating correlation matrix using `spearman` method.