Plot percentage of zeros vs. library depth
Source:R/AllGenerics.R, R/plotZerosVsDepth-methods.R
plotZerosVsDepth.RdPlot percentage of zeros vs. library depth
Usage
plotZerosVsDepth(object, ...)

# S4 method for class 'SummarizedExperiment'
plotZerosVsDepth(
  object,
  assay = 1L,
  interestingGroups = NULL,
  pointAlpha = getOption(x = "acid.point.alpha", default = 0.9),
  pointSize = getOption(x = "acid.point.size", default = 1L),
  labels = list(title = "Zeros vs. depth", subtitle = NULL, x = "library size (depth)", y
    = "dropout rate")
)
Arguments
- object
Object.
- assay
vector(1). Assay name or index position.- interestingGroups
character. Groups of interest to use for visualization. Corresponds to factors describing the columns of the object.- pointAlpha
numeric(1)(0-1). Alpha transparency level.- pointSize
numeric(1). Point size for dots in the plot. In the range of 1-3 is generally recommended.- labels
list. ggplot2 labels. Seeggplot2::labs()for details.- ...
Additional arguments.
Examples
data(
RangedSummarizedExperiment,
SingleCellExperiment_splatter,
package = "AcidTest"
)
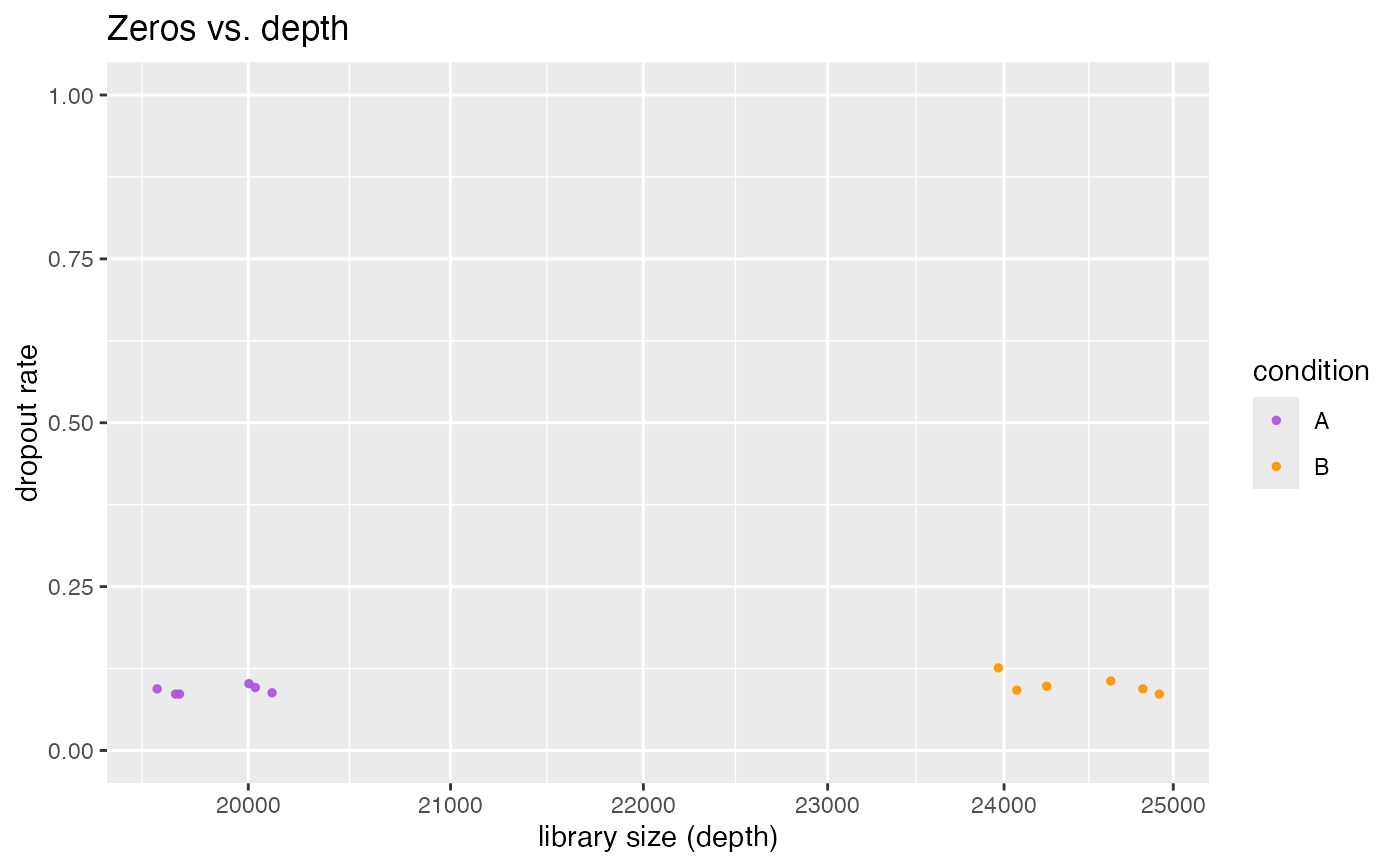
## SummarizedExperiment ====
object <- RangedSummarizedExperiment
plotZerosVsDepth(object)
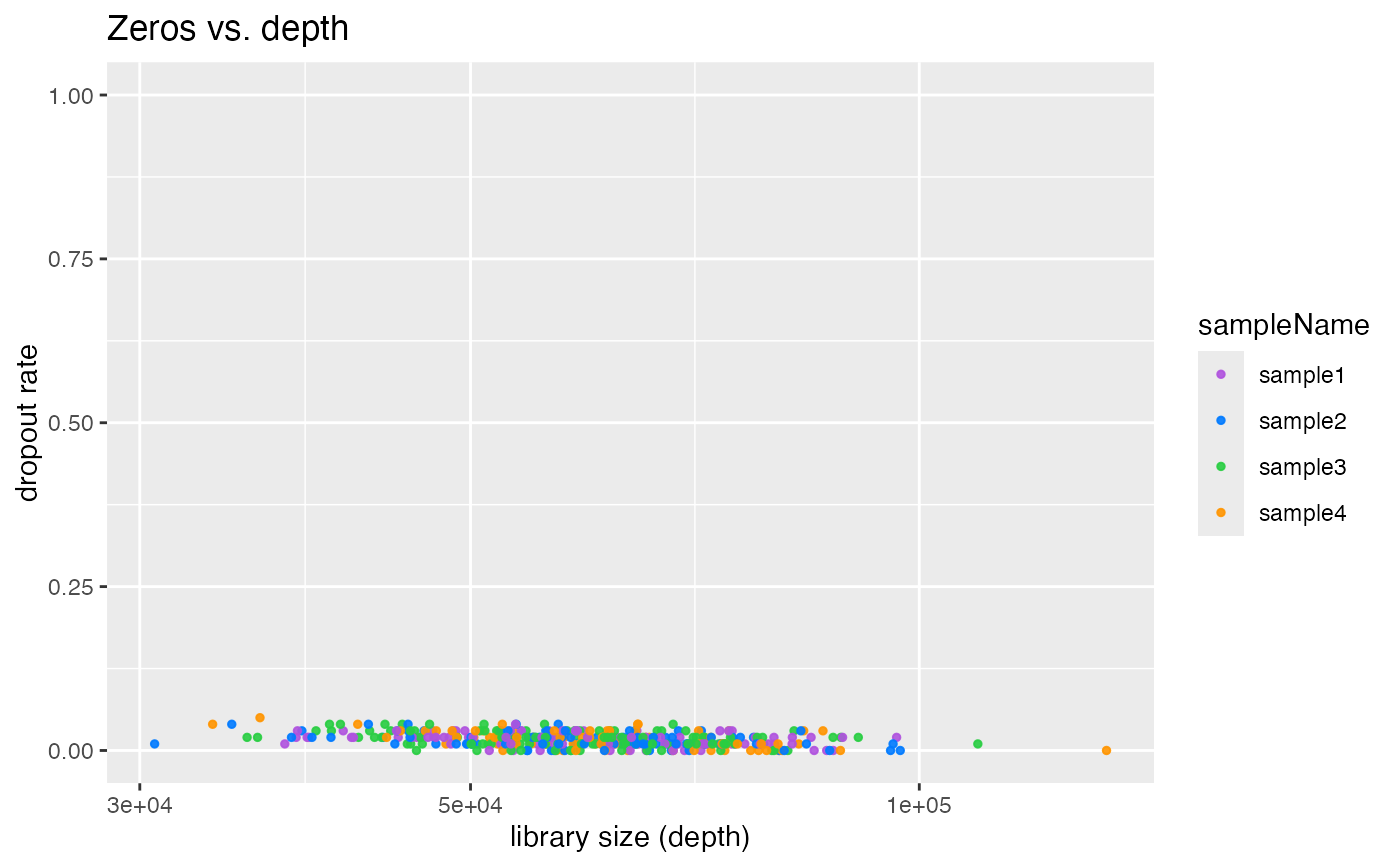
 ## SingleCellExperiment ====
object <- SingleCellExperiment_splatter
plotZerosVsDepth(object)
## SingleCellExperiment ====
object <- SingleCellExperiment_splatter
plotZerosVsDepth(object)