Plot waterfall
Usage
plotWaterfall(object, ...)

# S4 method for class 'DFrame'
plotWaterfall(
  object,
  sampleCol,
  valueCol,
  interestingGroups = NULL,
  trans = c("identity", "log2", "log10"),
  fill = purpleOrange(1L),
  labels = list(title = NULL, subtitle = NULL)
)

# S4 method for class 'SummarizedExperiment'
plotWaterfall(
  object,
  assay = 1L,
  fun = c("mean", "sum"),
  interestingGroups = NULL,
  ...
)

# S4 method for class 'data.frame'
plotWaterfall(
  object,
  sampleCol,
  valueCol,
  interestingGroups = NULL,
  trans = c("identity", "log2", "log10"),
  fill = purpleOrange(1L),
  labels = list(title = NULL, subtitle = NULL)
)
Arguments
- object
Object.
- sampleCol
character(1). Column name of discrete samples to plot on X axis.- valueCol
character(1). Column name of continues values to plot on Y axis.- interestingGroups
character. Groups of interest to use for visualization. Corresponds to factors describing the columns of the object.- trans
character(1). Name of the axis scale transformation to apply.For more information:
- fill
character(1). R color name or hex color code (e.g."#AF52DE").- labels
list. ggplot2 labels. Seeggplot2::labs()for details.- assay
vector(1). Assay name or index position.- fun
function.- ...
Additional arguments.
Examples
data(RangedSummarizedExperiment, package = "AcidTest")
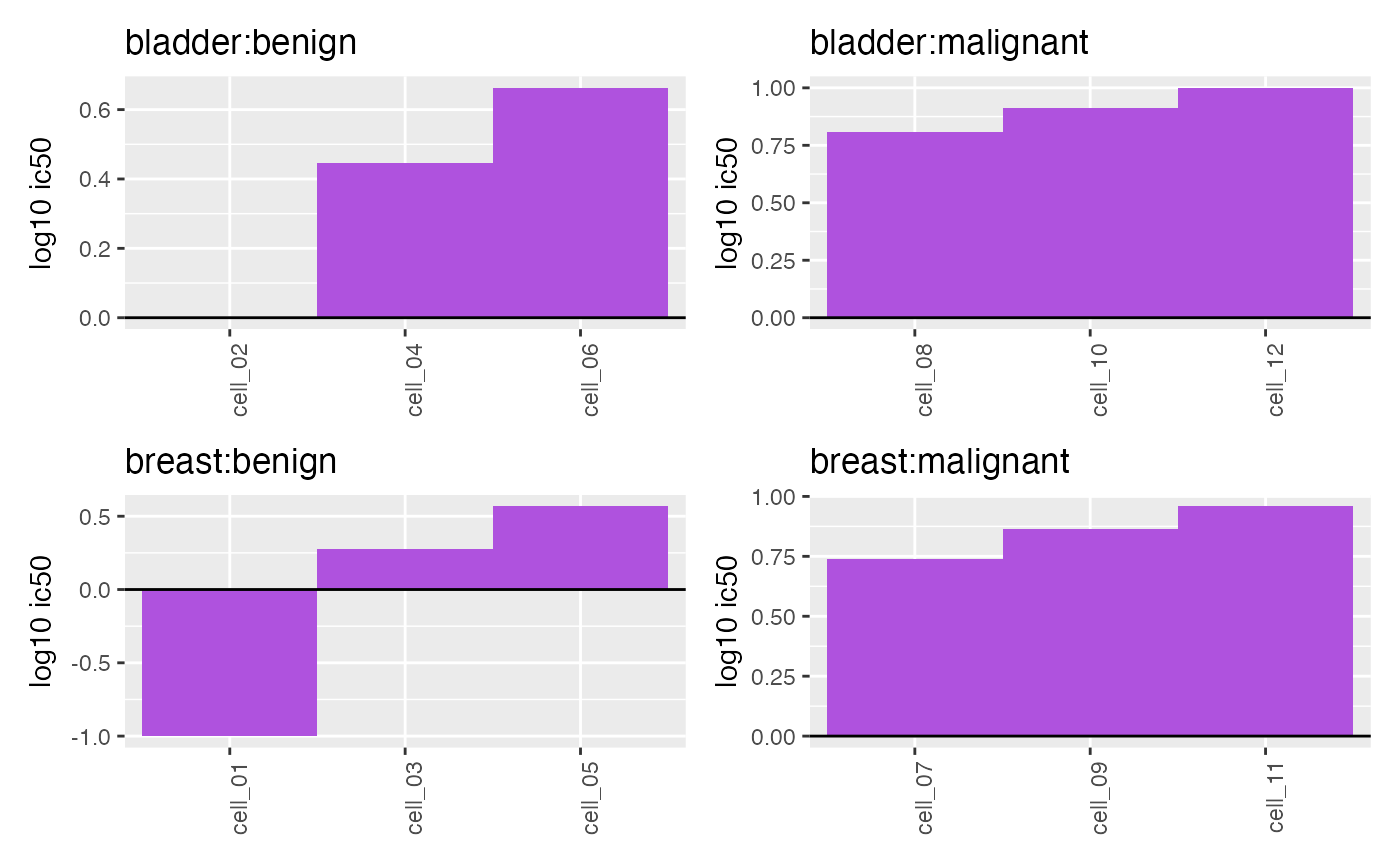
## data.frame ====
object <- data.frame(
"cellId" = AcidGenerics::autopadZeros(
object = paste("cell", seq_len(12L), sep = "_")
),
"ic50" = seq(
from = 0.1,
to = 10L,
length.out = 12L
),
"tumorType" = rep(
x = c("breast", "bladder"),
times = 6L
),
"tumorSubtype" = rep(
x = c("benign", "malignant"),
each = 6L
)
)
plotWaterfall(
object = object,
sampleCol = "cellId",
valueCol = "ic50",
interestingGroups = c("tumorType", "tumorSubtype"),
trans = "log10"
)
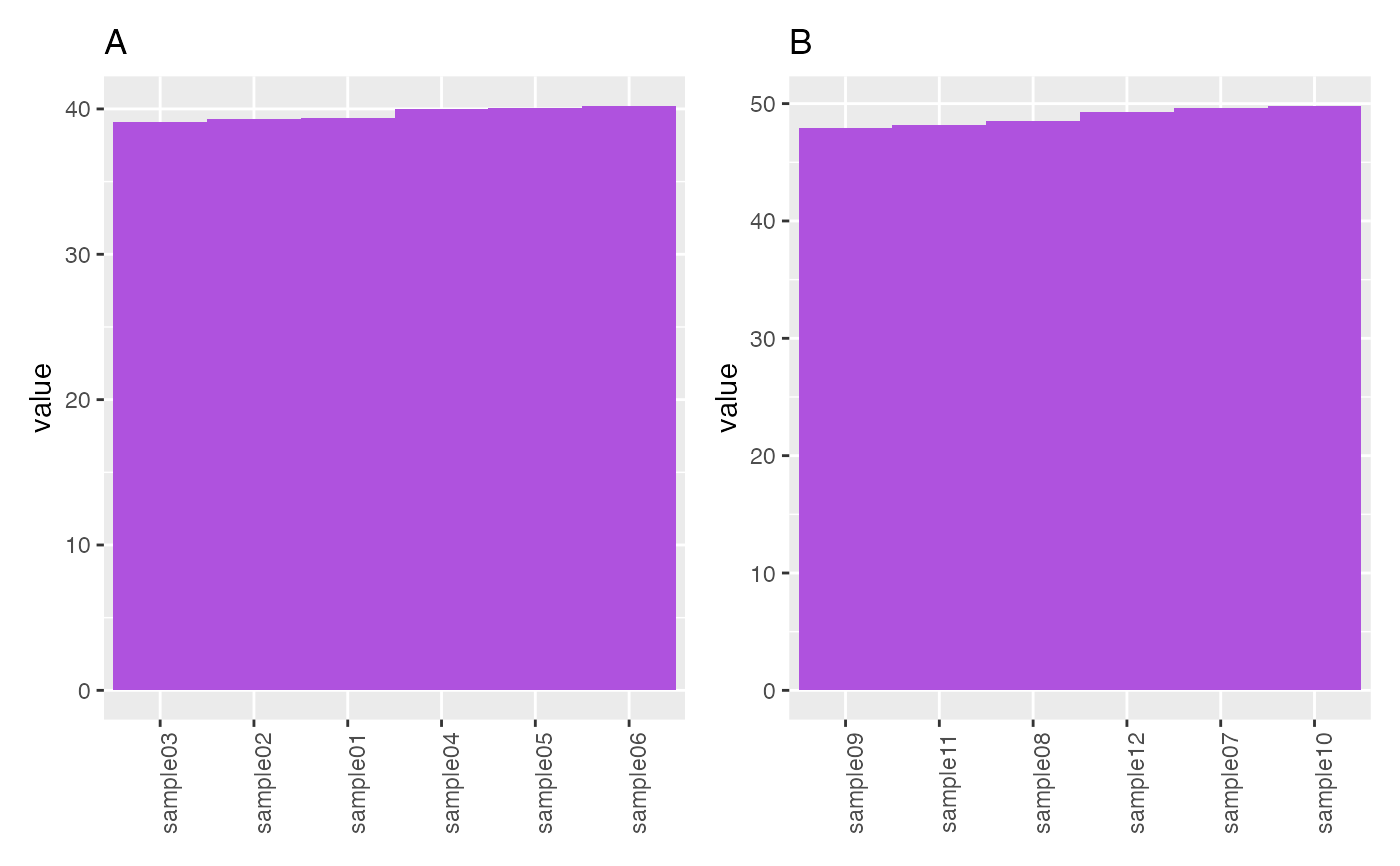
 ## SummarizedExperiment ====
object <- RangedSummarizedExperiment
plotWaterfall(object, trans = "identity")
## SummarizedExperiment ====
object <- RangedSummarizedExperiment
plotWaterfall(object, trans = "identity")