UpSet plot
Usage
plotUpset(object, ...)

# S4 method for class 'DFrame'
plotUpset(object, ...)

# S4 method for class 'data.frame'
plotUpset(object, ...)

# S4 method for class 'list'
plotUpset(object, ...)

# S4 method for class 'matrix'
plotUpset(
  object,
  minSize = 0L,
  maxSize = Inf,
  nIntersections = 40L,
  orderBySize = c(intersections = TRUE, sets = TRUE),
  labels = list(title = NULL, subtitle = NULL)
)
Arguments
- object
Object.
- ...
Additional arguments.
- minSize, maxSize
Non-negative
integer(1)orInf. Minimal/maximal number of observations in an intersection for it to be included. Defaults to all observations. Note thatmaxSizemust be greater thanminSize.- nIntersections
integer(1)orInf. Maximum number of intersections to plot. SetInfto plot all intersections.- orderBySize
logical. Whether to order main bar plot and/or intersection matrix by set size."intersection": refers to main intersection bar plot."sets": refers to set intersection matrix, shown as connected dots. WhenTRUE, orders by the set size (see plot to the left).
Can pass in
TRUE/FALSEboolean flag and both"intersection"and"sets"settings will inherit.- labels
list. ggplot2 labels. Seeggplot2::labs()for details.
Details
S4 wrapper for ComplexUpset::upset() with improved default aesthetics.
Examples
## list ====
list <- list(
"aaa" = c("a", "b", "c", "d", "e", "f"),
"bbb" = c("b", "c", "d", "e", "f", "g"),
"ccc" = c("c", "d", "e", "f", "g", "h"),
"ddd" = c("d", "e", "f", "g", "h", "i")
)
print(list)
#> $aaa
#> [1] "a" "b" "c" "d" "e" "f"
#>
#> $bbb
#> [1] "b" "c" "d" "e" "f" "g"
#>
#> $ccc
#> [1] "c" "d" "e" "f" "g" "h"
#>
#> $ddd
#> [1] "d" "e" "f" "g" "h" "i"
#>
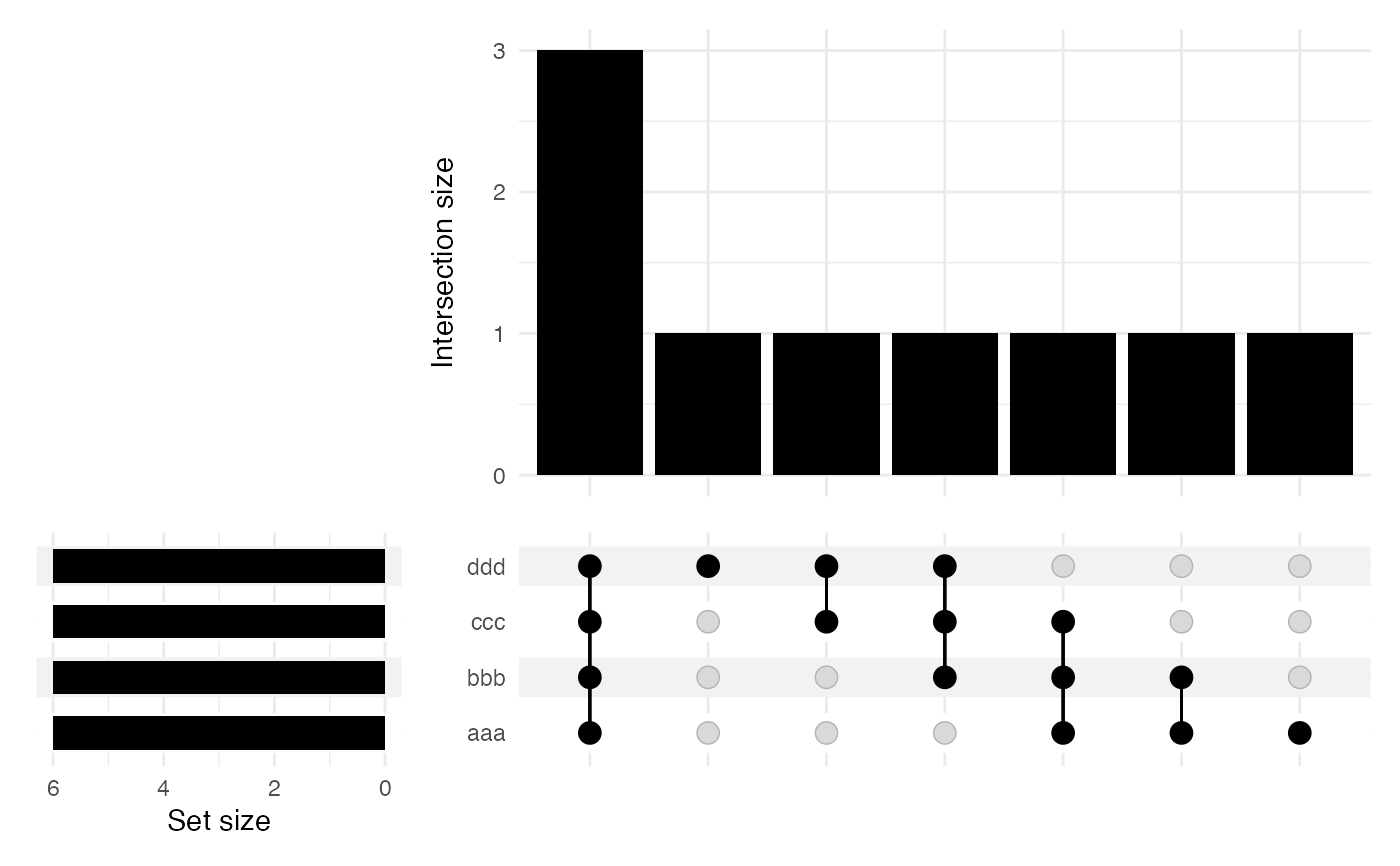
plotUpset(list)
 ## matrix ====
mat <- AcidBase::intersectionMatrix(list)
print(mat)
#> aaa bbb ccc ddd
#> a TRUE FALSE FALSE FALSE
#> b TRUE TRUE FALSE FALSE
#> c TRUE TRUE TRUE FALSE
#> d TRUE TRUE TRUE TRUE
#> e TRUE TRUE TRUE TRUE
#> f TRUE TRUE TRUE TRUE
#> g FALSE TRUE TRUE TRUE
#> h FALSE FALSE TRUE TRUE
#> i FALSE FALSE FALSE TRUE
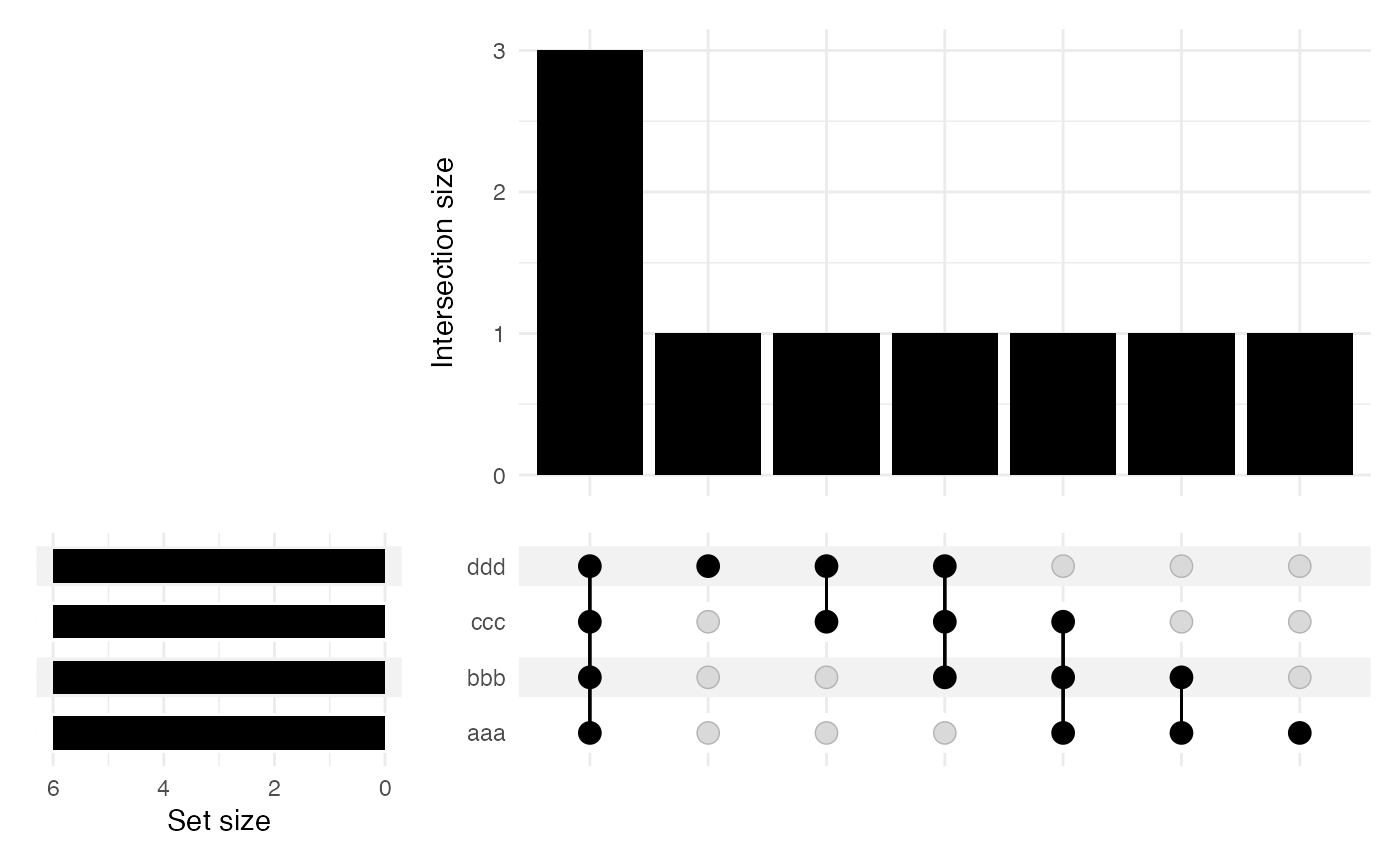
plotUpset(mat)
## matrix ====
mat <- AcidBase::intersectionMatrix(list)
print(mat)
#> aaa bbb ccc ddd
#> a TRUE FALSE FALSE FALSE
#> b TRUE TRUE FALSE FALSE
#> c TRUE TRUE TRUE FALSE
#> d TRUE TRUE TRUE TRUE
#> e TRUE TRUE TRUE TRUE
#> f TRUE TRUE TRUE TRUE
#> g FALSE TRUE TRUE TRUE
#> h FALSE FALSE TRUE TRUE
#> i FALSE FALSE FALSE TRUE
plotUpset(mat)