Plot total read counts
Usage
plotTotalCounts(object, ...)

# S4 method for class 'SingleCellExperiment'
plotTotalCounts(object, ...)

# S4 method for class 'SummarizedExperiment'
plotTotalCounts(
  object,
  assay = 1L,
  interestingGroups = NULL,
  perMillion = FALSE,
  labels = list(title = "Total counts", subtitle = NULL, x = NULL, y = "counts"),
  flip = getOption(x = "acid.flip", default = TRUE)
)
Arguments
- object
Object.
- ...
Additional arguments.
- assay
vector(1). Assay name or index position.- interestingGroups
character. Groups of interest to use for visualization. Corresponds to factors describing the columns of the object.- perMillion
logical(1). Display as counts per million.- labels
list. ggplot2 labels. Seeggplot2::labs()for details.- flip
logical(1). Flip x and y axes. Recommended for plots containing many samples.
Functions
plotTotalCounts(SingleCellExperiment): AppliesaggregateCellsToSamples()calculation to summarize at sample level prior to plotting.
Passes...toSummarizedExperimentmethod.
Examples
data(
RangedSummarizedExperiment,
SingleCellExperiment_splatter,
package = "AcidTest"
)
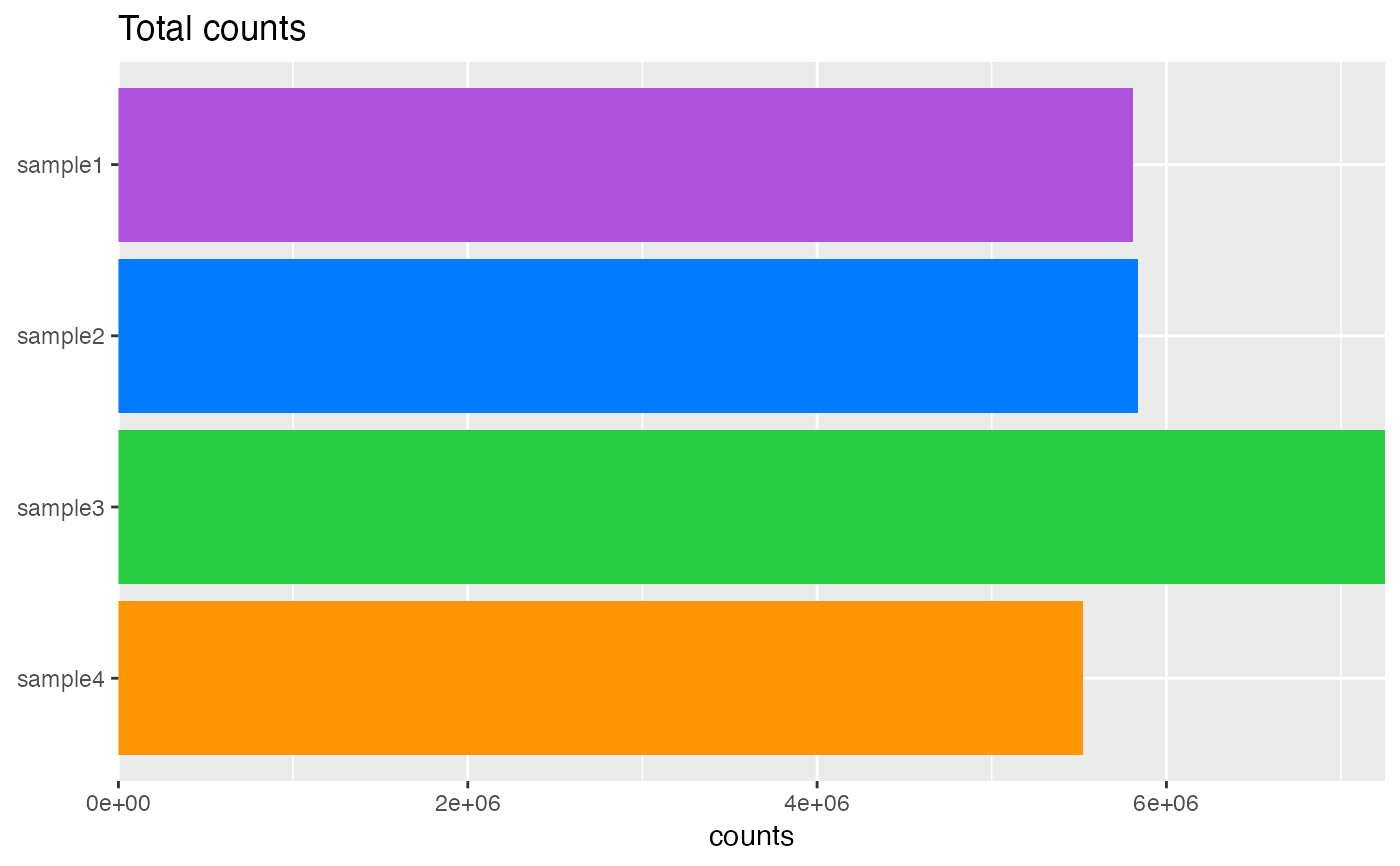
## SummarizedExperiment ====
object <- RangedSummarizedExperiment
plotTotalCounts(object)
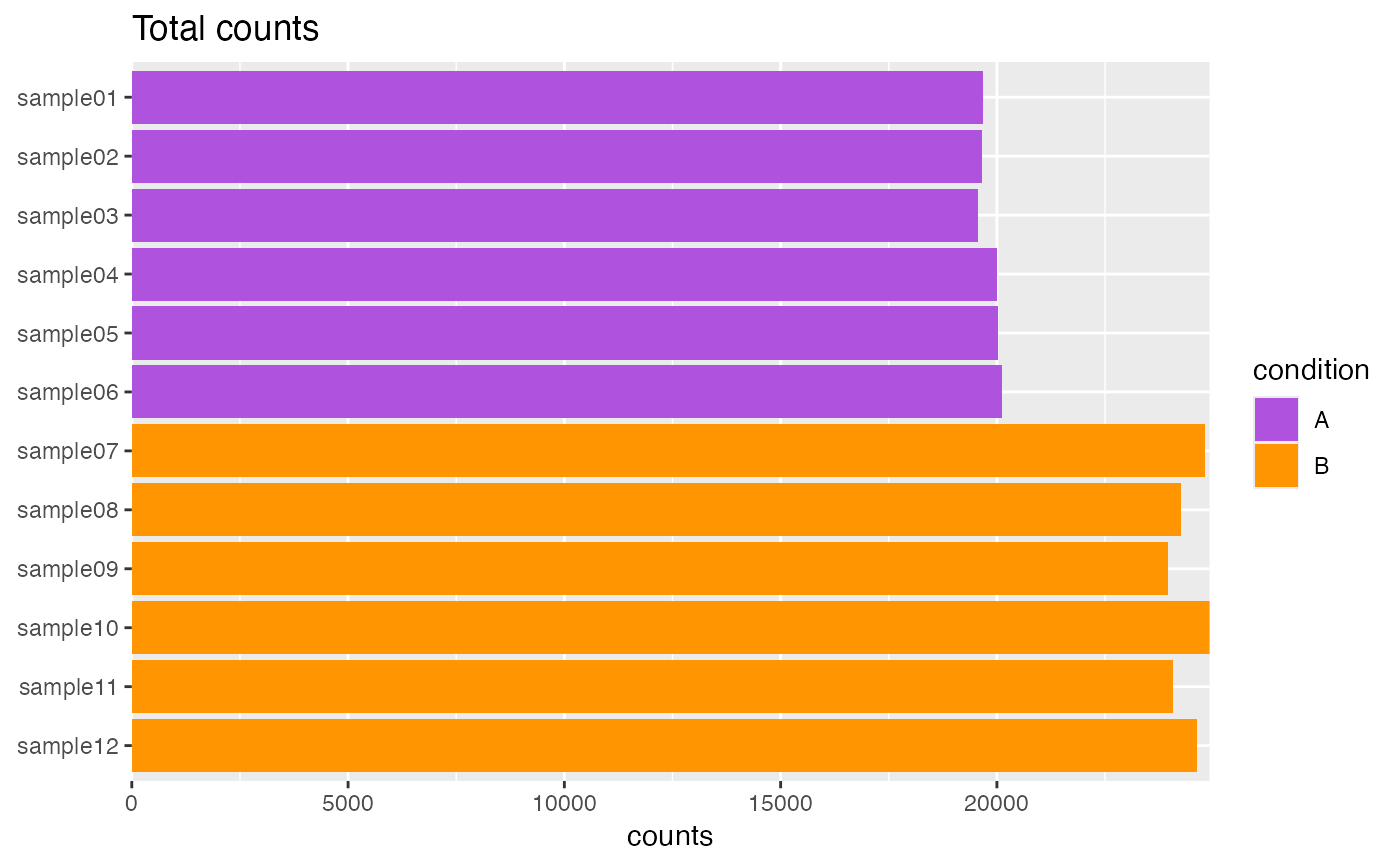 ## SingleCellExperiment ====
object <- SingleCellExperiment_splatter
plotTotalCounts(object)
## SingleCellExperiment ====
object <- SingleCellExperiment_splatter
plotTotalCounts(object)