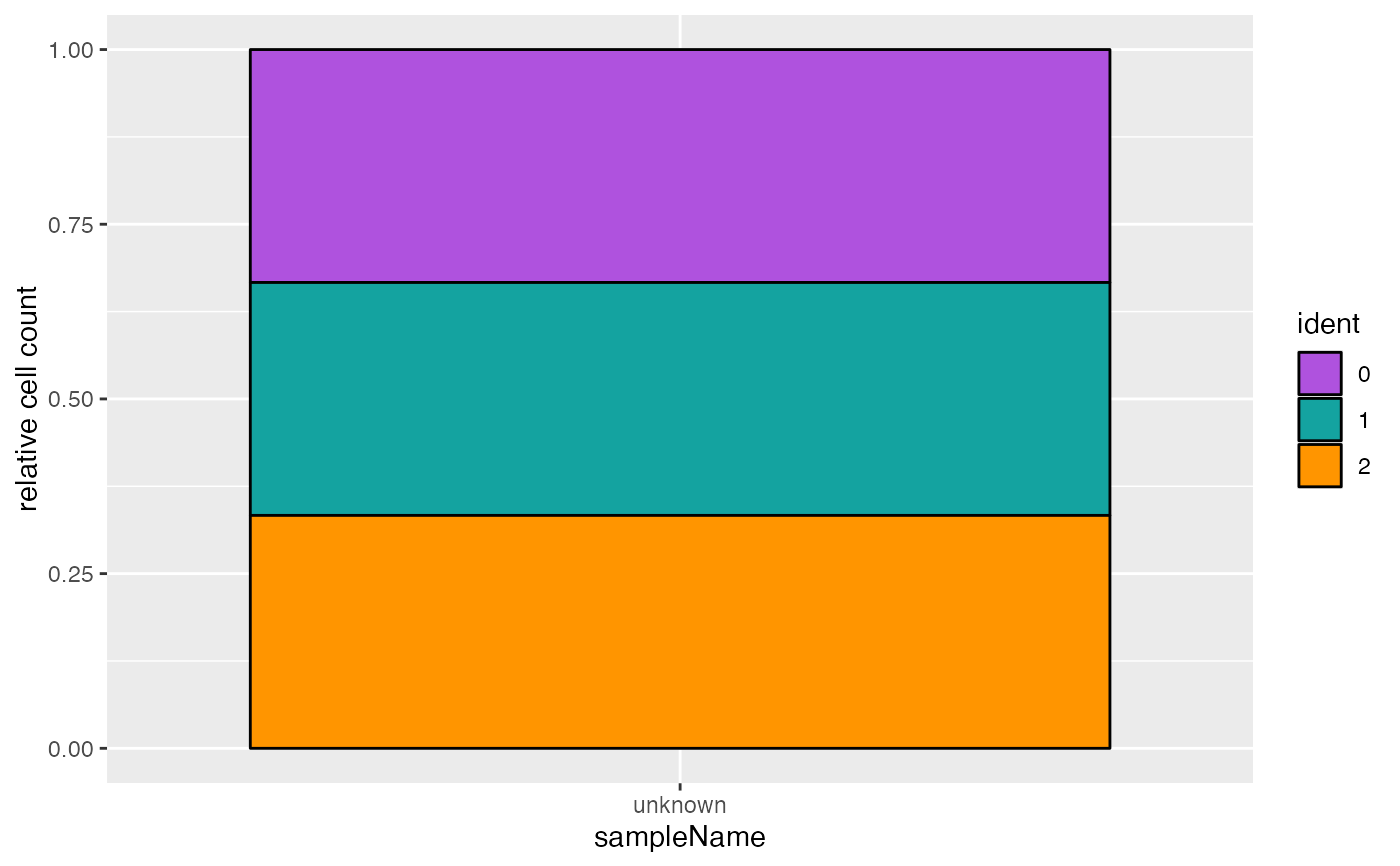
Plot stacked bar plot
Usage
plotStackedBarPlot(object, ...)

# S4 method for class 'SingleCellExperiment'
plotStackedBarPlot(
  object,
  absolute = FALSE,
  interestingGroups = NULL,
  labels = NULL
)
Arguments
- object
Object.
- absolute
logical(1). Return absolute (TRUE) or relative/proportional (FALSE) cell count.- interestingGroups
character. Groups of interest to use for visualization. Corresponds to factors describing the columns of the object.- labels
list. ggplot2 labels. Seeggplot2::labs()for details.- ...
Additional arguments.
Examples
data(SingleCellExperiment_Seurat, package = "AcidTest")

## SingleCellExperiment ====
object <- SingleCellExperiment_Seurat
plotStackedBarPlot(object)
#> Warning: The dim() method for DataFrameList objects is deprecated. Please use
#>   dims() on these objects instead.
#> Warning: The nrow() method for DataFrameList objects is deprecated. Please use
#>   nrows() on these objects instead.
#> Warning: The ncol() method for CompressedSplitDataFrameList objects is
#>   deprecated. Please use ncols() on these objects instead.