Plot count and feature correlation
Source:R/AllGenerics.R, R/plotCountsVsFeatures-methods.R
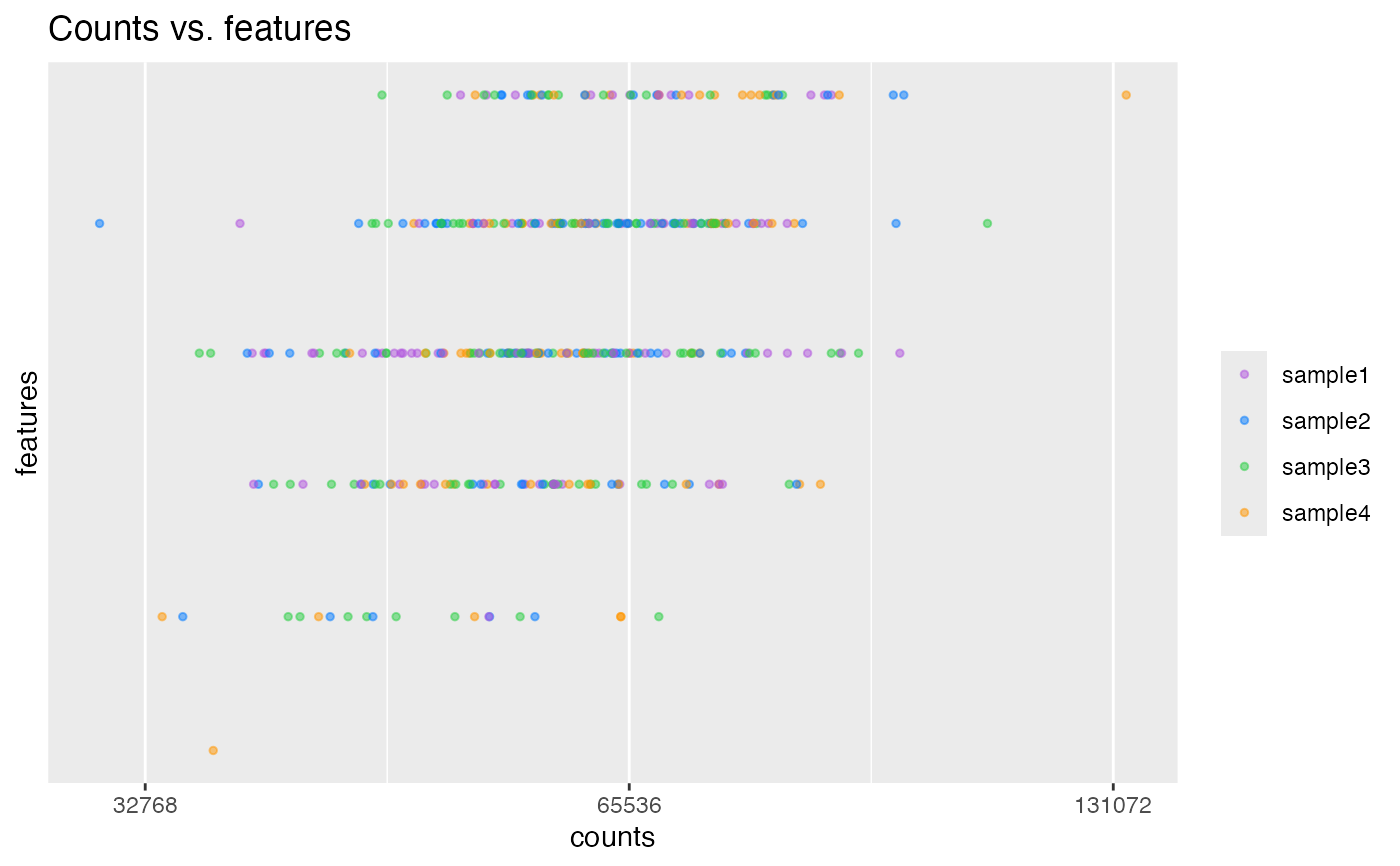
plotCountsVsFeatures.RdPlot the disambiguated counts per cell vs. features (i.e. genes or transcripts) detected.
Usage
plotCountsVsFeatures(object, ...)

# S4 method for class 'SingleCellExperiment'
plotCountsVsFeatures(
  object,
  interestingGroups = NULL,
  trendline = FALSE,
  trans = "log2",
  labels = list(title = "Counts vs. features", subtitle = NULL, x = "counts", y =
    "features")
)
Arguments
- object
Object.
- interestingGroups
character. Groups of interest to use for visualization. Corresponds to factors describing the columns of the object.- trendline
logical(1). Include trendline on plot.- trans
character(1). Name of the axis scale transformation to apply.For more information:
- labels
list. ggplot2 labels. Seeggplot2::labs()for details.- ...
Additional arguments.
Details
"Counts" refer to universal molecular identifier (UMI) counts for droplet-based scRNA-seq data.
Examples
data(SingleCellExperiment_splatter, package = "AcidTest")

## SingleCellExperiment ====
object <- SingleCellExperiment_splatter
plotCountsVsFeatures(object)