Plot counts per feature
Source:R/AllGenerics.R, R/plotCountsPerFeature-methods.R
plotCountsPerFeature.RdGenerally, we expect similar count spreads for all genes between samples unless the library sizes or total RNA expression are different.
Usage
plotCountsPerFeature(object, ...)

# S4 method for class 'SingleCellExperiment'
plotCountsPerFeature(object, ...)

# S4 method for class 'SummarizedExperiment'
plotCountsPerFeature(
  object,
  assay = 1L,
  interestingGroups = NULL,
  geom = c("boxplot", "density", "jitter"),
  trans = c("identity", "log2", "log10"),
  labels = list(title = "Counts per feature", subtitle = NULL, sampleAxis = NULL,
    countAxis = "counts"),
  flip = getOption(x = "acid.flip", default = TRUE),
  minMethod = c("absolute", "perRow")
)
Arguments
- object
Object.
- ...
Additional arguments.
- assay
vector(1). Assay name or index position.- interestingGroups
character. Groups of interest to use for visualization. Corresponds to factors describing the columns of the object.- geom
character(1). Type of ggplot2 geometric object to use.- trans
character(1). Apply a log transformation (e.g.log2(x + 1L)) to the count matrix prior to melting, if desired. Use"identity"to return unmodified (default).- labels
list. ggplot2 labels. Seeggplot2::labs()for details.- flip
logical(1). Flip x and y axes. Recommended for plots containing many samples.- minMethod
character(1). Only applies whenminargument is numeric. Usesmatch.arg().absolute: Applies hard cutoff tocountscolumn after the melt operation. This applies to all counts, not per feature.perRow: Applies cutoff per row (i.e. gene). Internally,rowSums()values are checked against this cutoff threshold prior to the melt operation.
Functions
plotCountsPerFeature(SingleCellExperiment): AppliesaggregateCellsToSamples()calculation to summarize at sample level prior to plotting.
Passes...toSummarizedExperimentmethod.
Examples
data(
RangedSummarizedExperiment,
SingleCellExperiment_splatter,
package = "AcidTest"
)
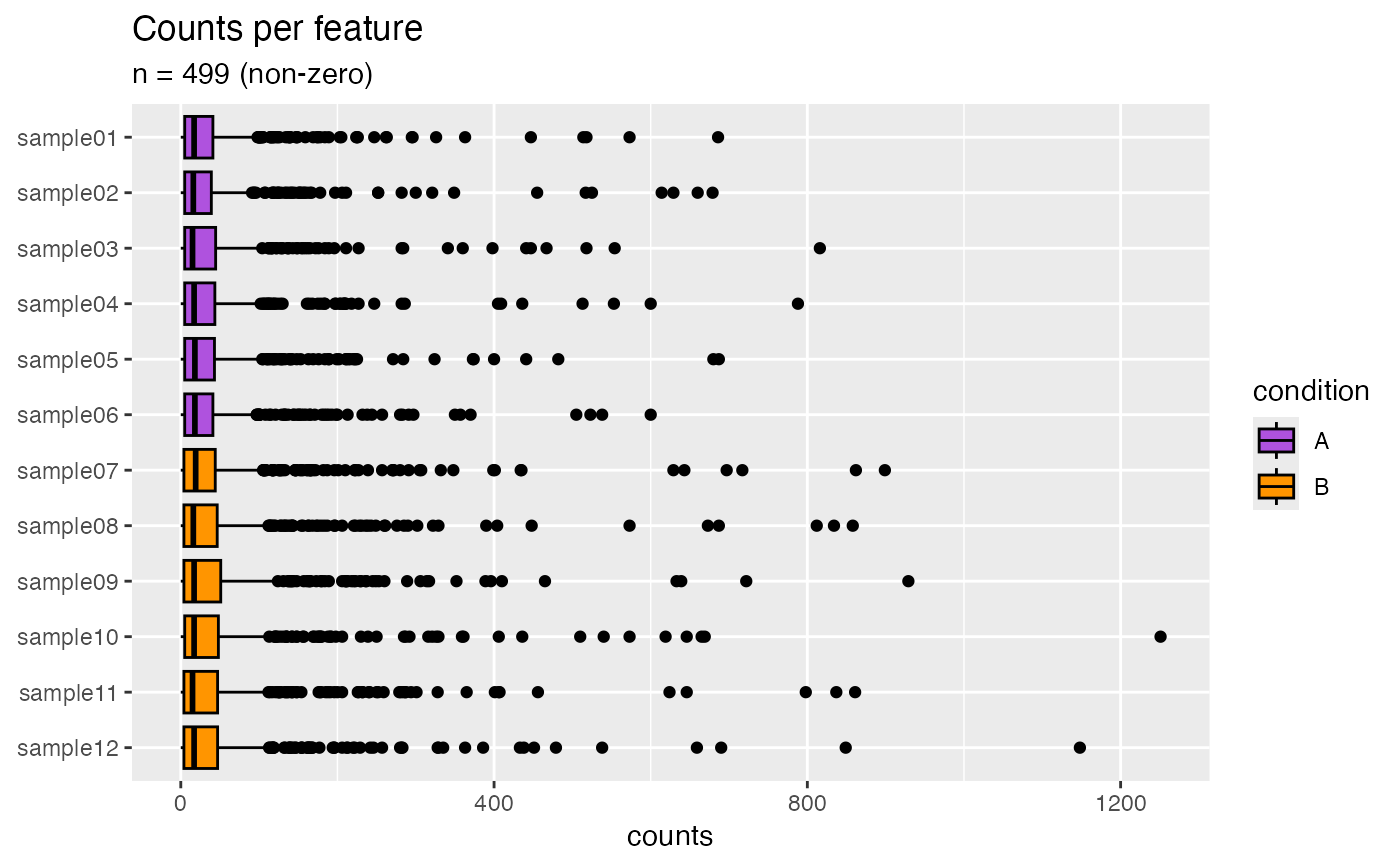
## SummarizedExperiment ====
object <- RangedSummarizedExperiment
plotCountsPerFeature(object, geom = "boxplot")
#> ℹ Filtered zero count rows and columns:
#> - 499 / 500 rows (100%)
#> - 12 / 12 columns (100%)
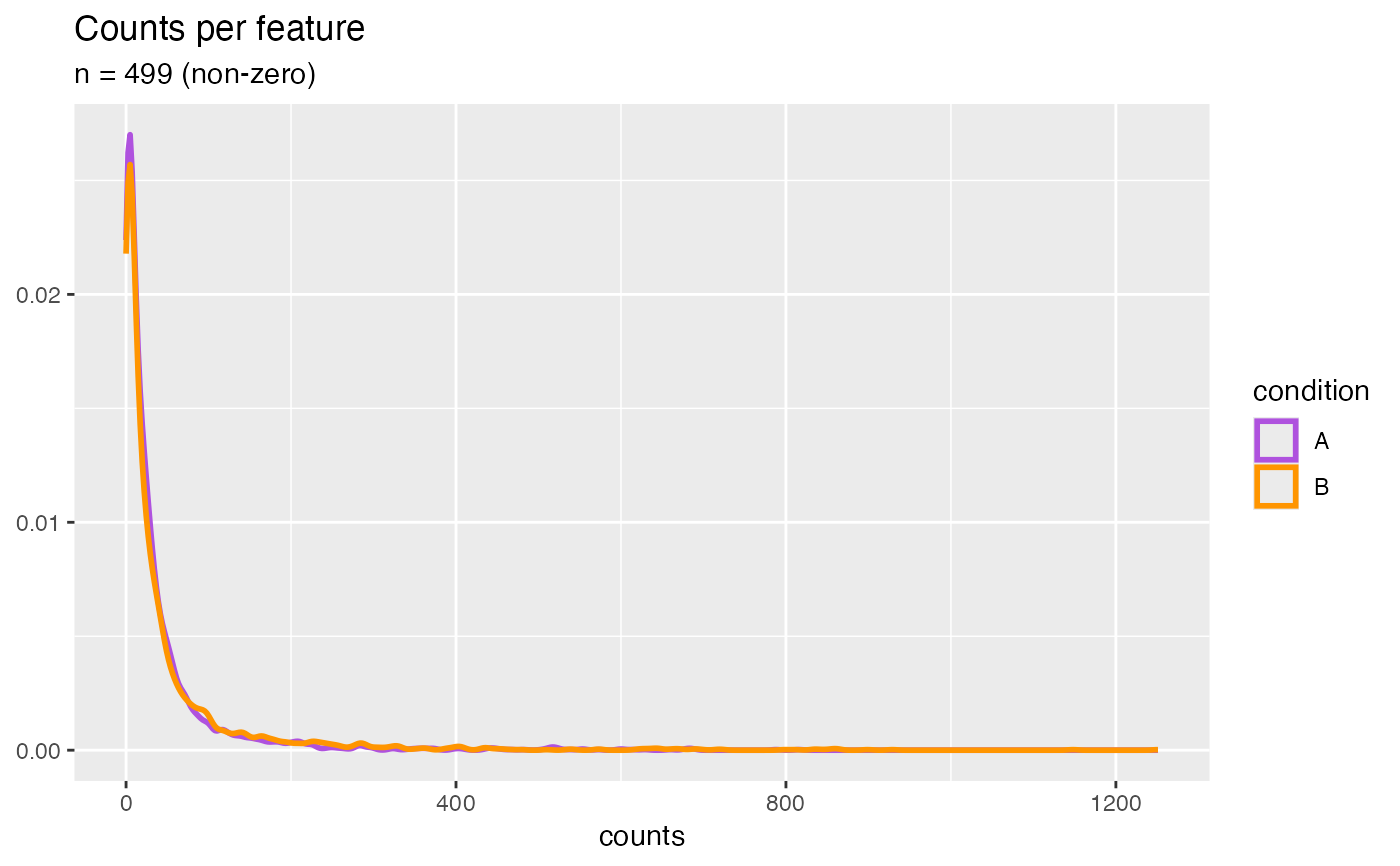
 plotCountsPerFeature(object, geom = "density")
#> ℹ Filtered zero count rows and columns:
#> - 499 / 500 rows (100%)
#> - 12 / 12 columns (100%)
plotCountsPerFeature(object, geom = "density")
#> ℹ Filtered zero count rows and columns:
#> - 499 / 500 rows (100%)
#> - 12 / 12 columns (100%)
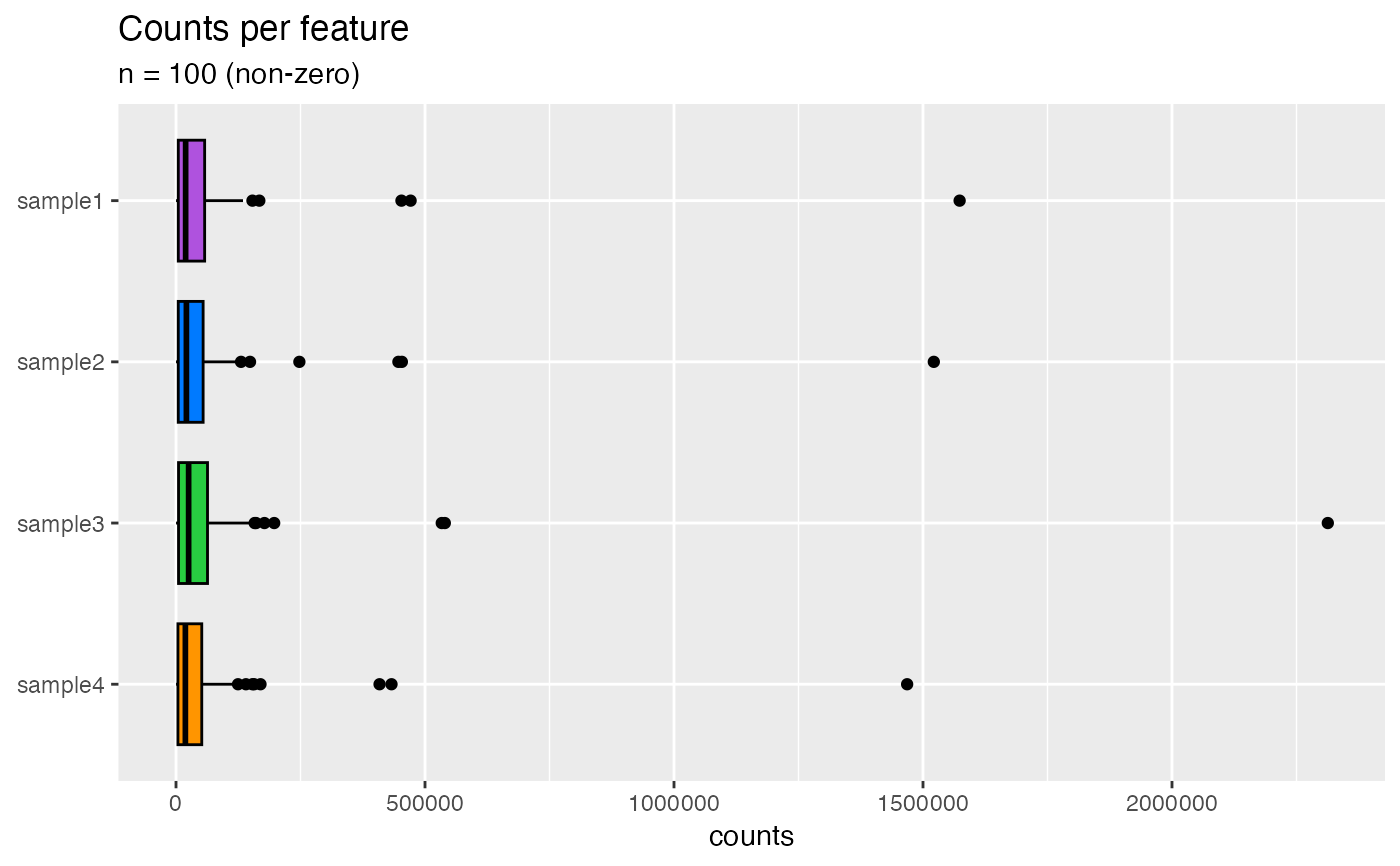
 ## SingleCellExperiment ====
object <- SingleCellExperiment_splatter
plotCountsPerFeature(object)
## SingleCellExperiment ====
object <- SingleCellExperiment_splatter
plotCountsPerFeature(object)