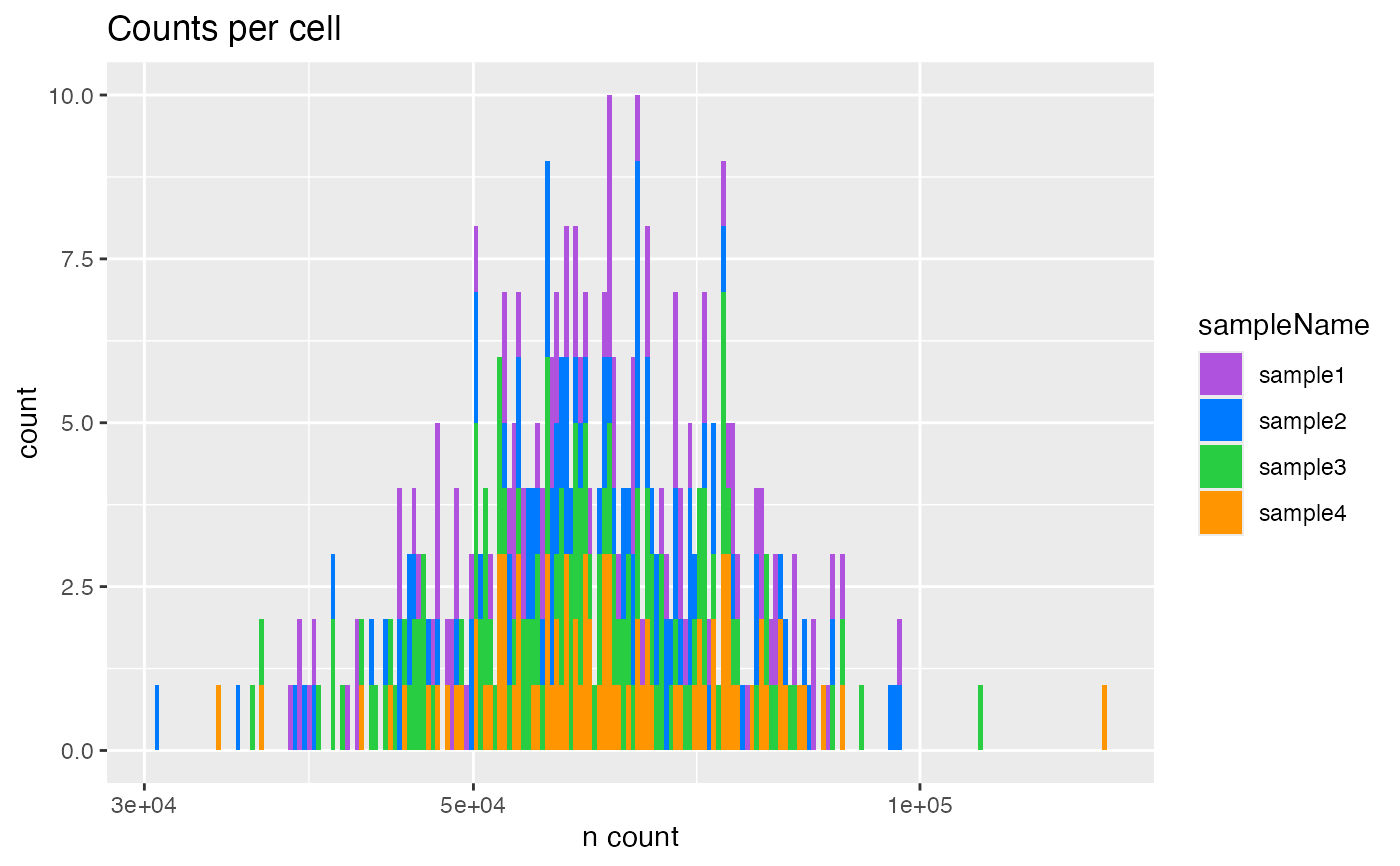
Plot the disambiguated counts per cell.
Usage
plotCountsPerCell(object, ...)

# S4 method for class 'SingleCellExperiment'
plotCountsPerCell(
  object,
  geom = c("histogram", "ecdf", "violin", "ridgeline", "boxplot"),
  interestingGroups = NULL,
  min = 0L,
  max = Inf,
  point = c("none", "inflection", "knee"),
  trans = "log10",
  title = "Counts per cell"
)
Arguments
- object
Object.
- geom
character(1). Plot type. Usesmatch.arg()internally and defaults to the first argument in thecharactervector.- interestingGroups
character. Groups of interest to use for visualization. Corresponds to factors describing the columns of the object.- min
numeric(1). Recommended minimum value cutoff.- max
numeric(1). Recommended maximum value cutoff.- point
character(1). Label either the knee or inflection points per sample. Requiresgeom = "ecdf".- trans
character(1). Name of the axis scale transformation to apply.For more information:
- title
character(1). Title.- ...
Additional arguments.
Details
"Counts" refer to universal molecular identifier (UMI) counts for droplet-based scRNA-seq data.
Examples
data(SingleCellExperiment_splatter, package = "AcidTest")
## SingleCellExperiment ====
object <- SingleCellExperiment_splatter
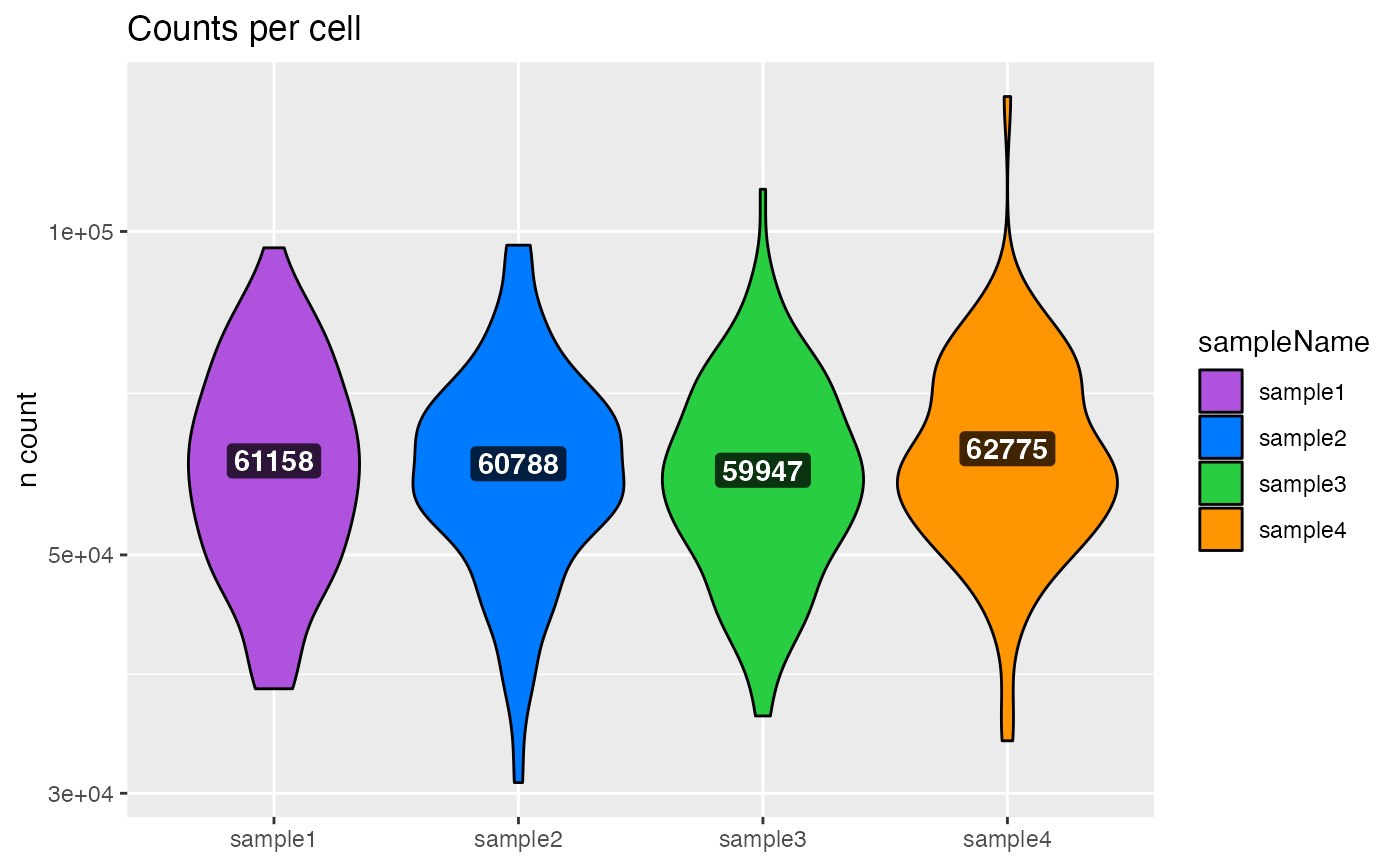
plotCountsPerCell(object, geom = "violin")
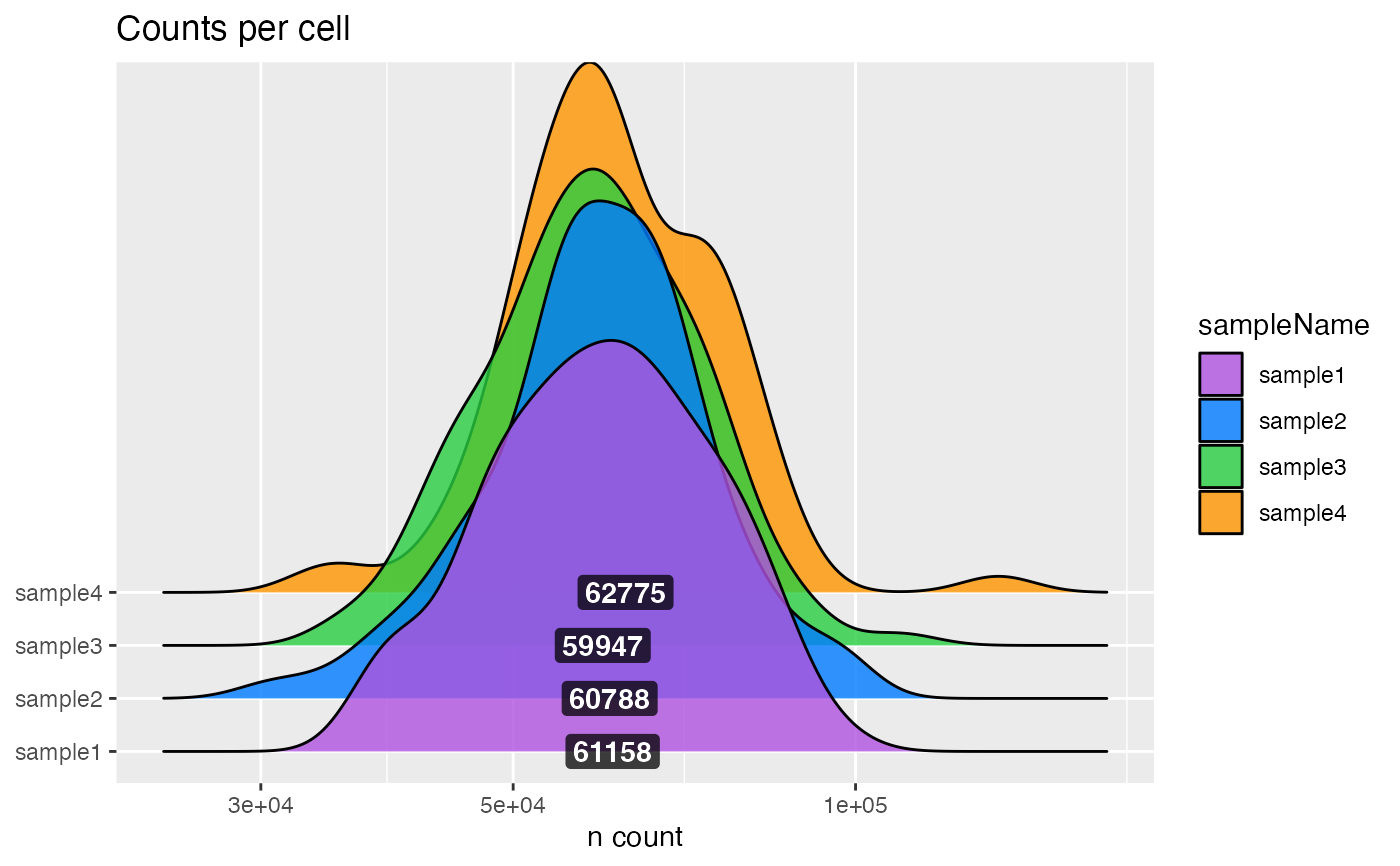
 plotCountsPerCell(object, geom = "ridgeline")
#> Picking joint bandwidth of 0.0318
plotCountsPerCell(object, geom = "ridgeline")
#> Picking joint bandwidth of 0.0318
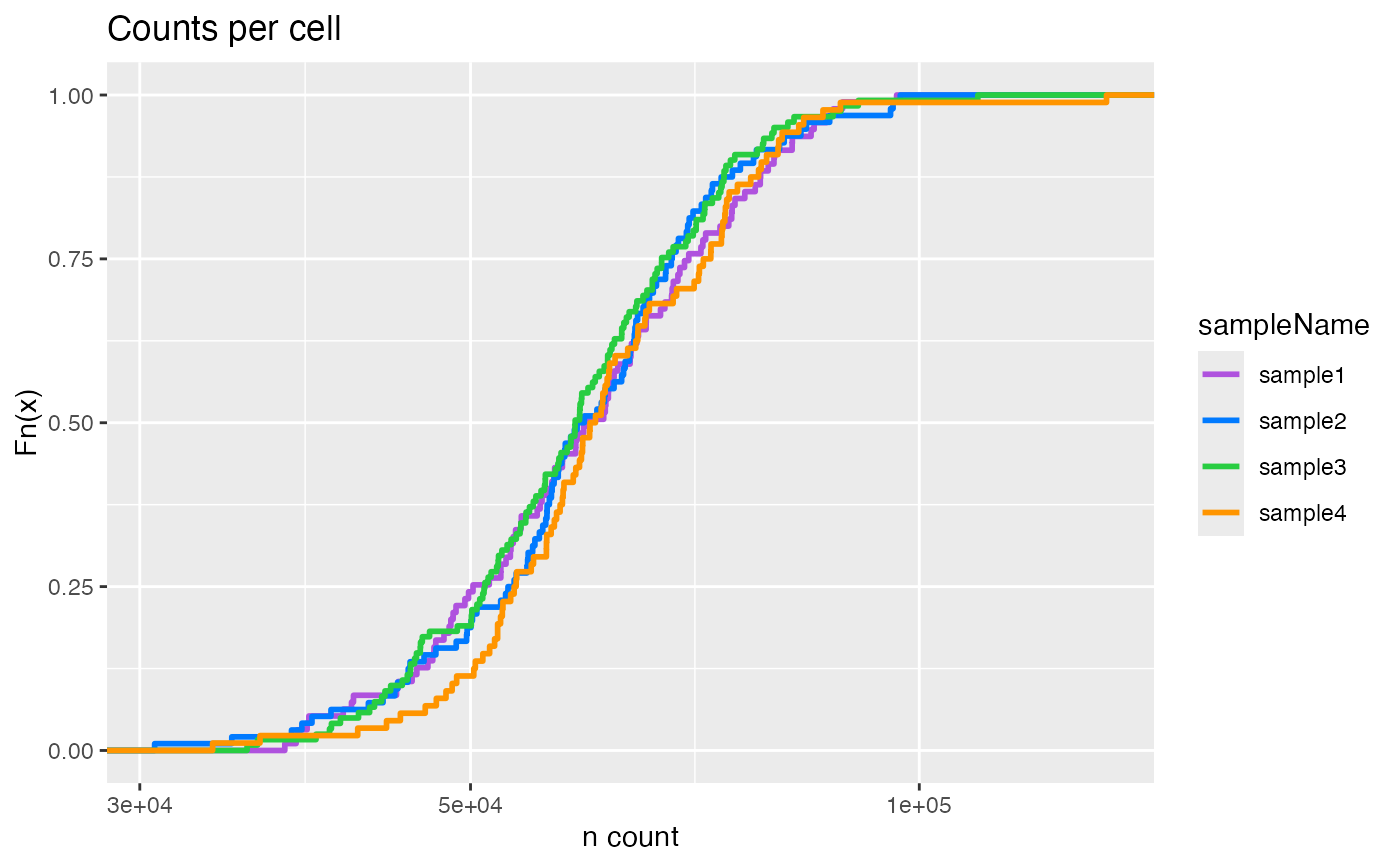
 plotCountsPerCell(object, geom = "ecdf")
 plotCountsPerCell(object, geom = "histogram")
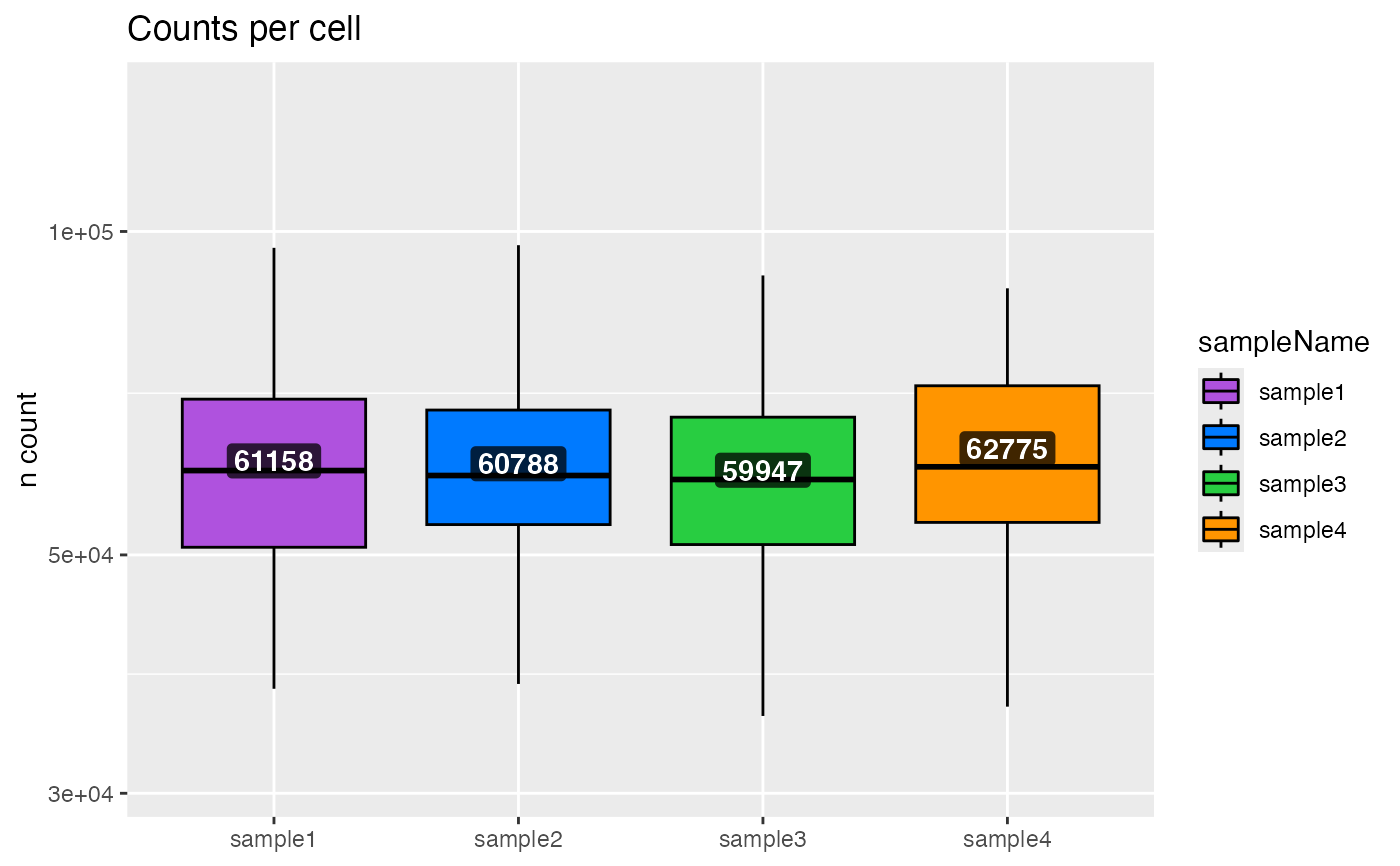
 plotCountsPerCell(object, geom = "boxplot")