Plot counts per biotype
Source:R/AllGenerics.R, R/plotCountsPerBiotype-methods.R
plotCountsPerBiotype.RdPlot counts per biotype
Usage
plotCountsPerBiotype(object, ...)

plotCountsPerBroadClass(object, ...)

# S4 method for class 'SingleCellExperiment'
plotCountsPerBiotype(
  object,
  assay = 1L,
  biotypeCol = "geneBiotype",
  n = 9L,
  interestingGroups = NULL,
  geom = c("violin", "boxplot"),
  trans = c("identity", "log2", "log10"),
  labels = list(title = "Counts per biotype", subtitle = NULL, sampleAxis = NULL,
    countAxis = "counts")
)

# S4 method for class 'SummarizedExperiment'
plotCountsPerBiotype(
  object,
  assay = 1L,
  biotypeCol = "geneBiotype",
  n = 9L,
  interestingGroups = NULL,
  geom = c("violin", "boxplot"),
  trans = c("identity", "log2", "log10"),
  labels = list(title = "Counts per biotype", subtitle = NULL, sampleAxis = NULL,
    countAxis = "counts")
)

# S4 method for class 'SingleCellExperiment'
plotCountsPerBroadClass(
  object,
  ...,
  labels = list(title = "Counts per broad class biotype", subtitle = NULL, sampleAxis =
    NULL, countAxis = "counts")
)

# S4 method for class 'SummarizedExperiment'
plotCountsPerBroadClass(
  object,
  ...,
  labels = list(title = "Counts per broad class biotype", subtitle = NULL, sampleAxis =
    NULL, countAxis = "counts")
)
Arguments
- object
Object.
- assay
vector(1). Assay name or index position.- biotypeCol
character(1). Biotype column name defined incolData().- n
integer(1). Number to include.- interestingGroups
character. Groups of interest to use for visualization. Corresponds to factors describing the columns of the object.- geom
character(1). Plot type. Usesmatch.arg()internally and defaults to the first argument in thecharactervector.- trans
character(1). Name of the axis scale transformation to apply.For more information:
- labels
list. ggplot2 labels. Seeggplot2::labs()for details.- ...
Additional arguments.
Examples
data(
RangedSummarizedExperiment,
SingleCellExperiment_splatter,
package = "AcidTest"
)
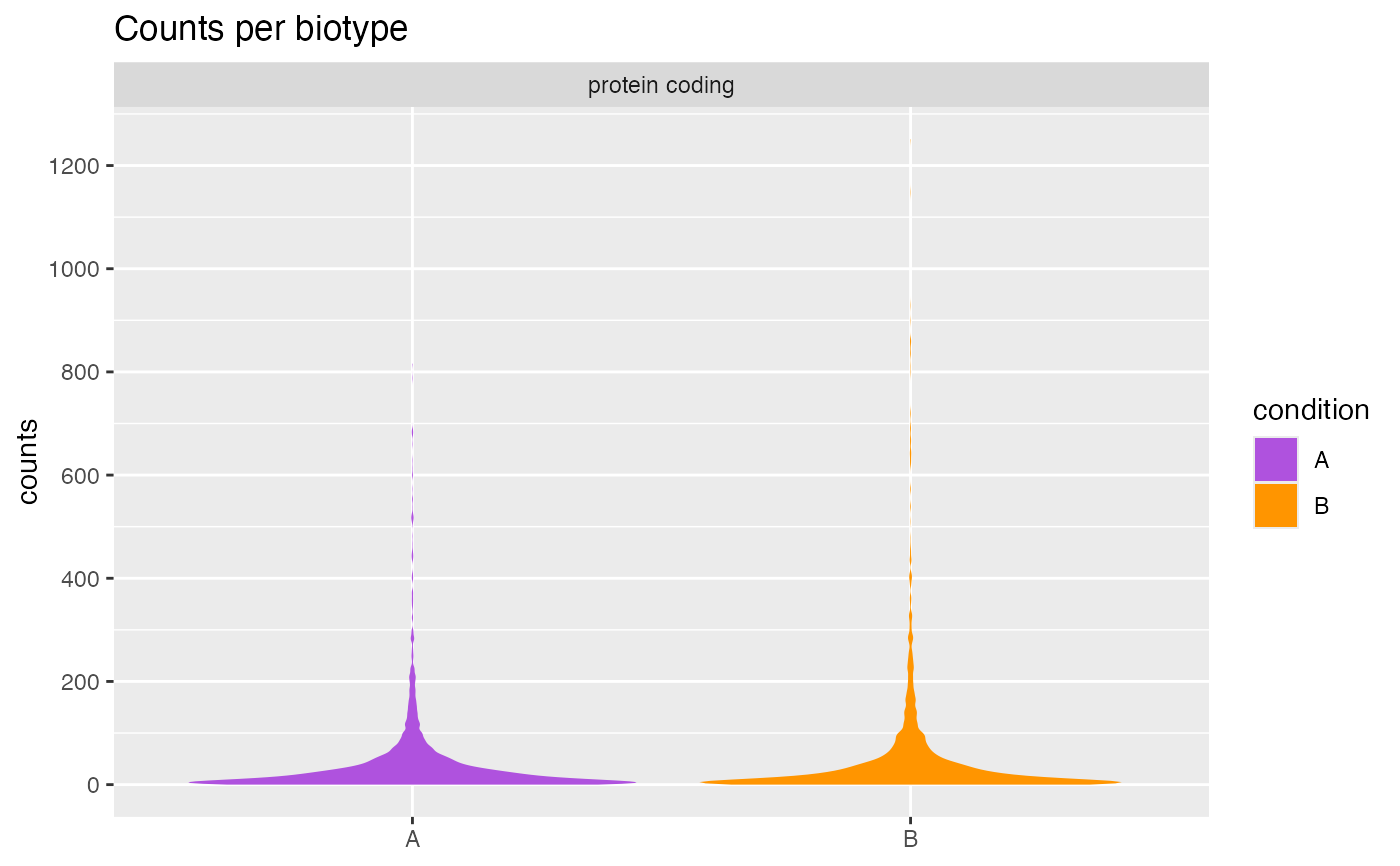
## SummarizedExperiment ====
object <- RangedSummarizedExperiment
plotCountsPerBiotype(object)
#> ℹ 499 / 500 features passed `perRow` >= "1" cutoff.
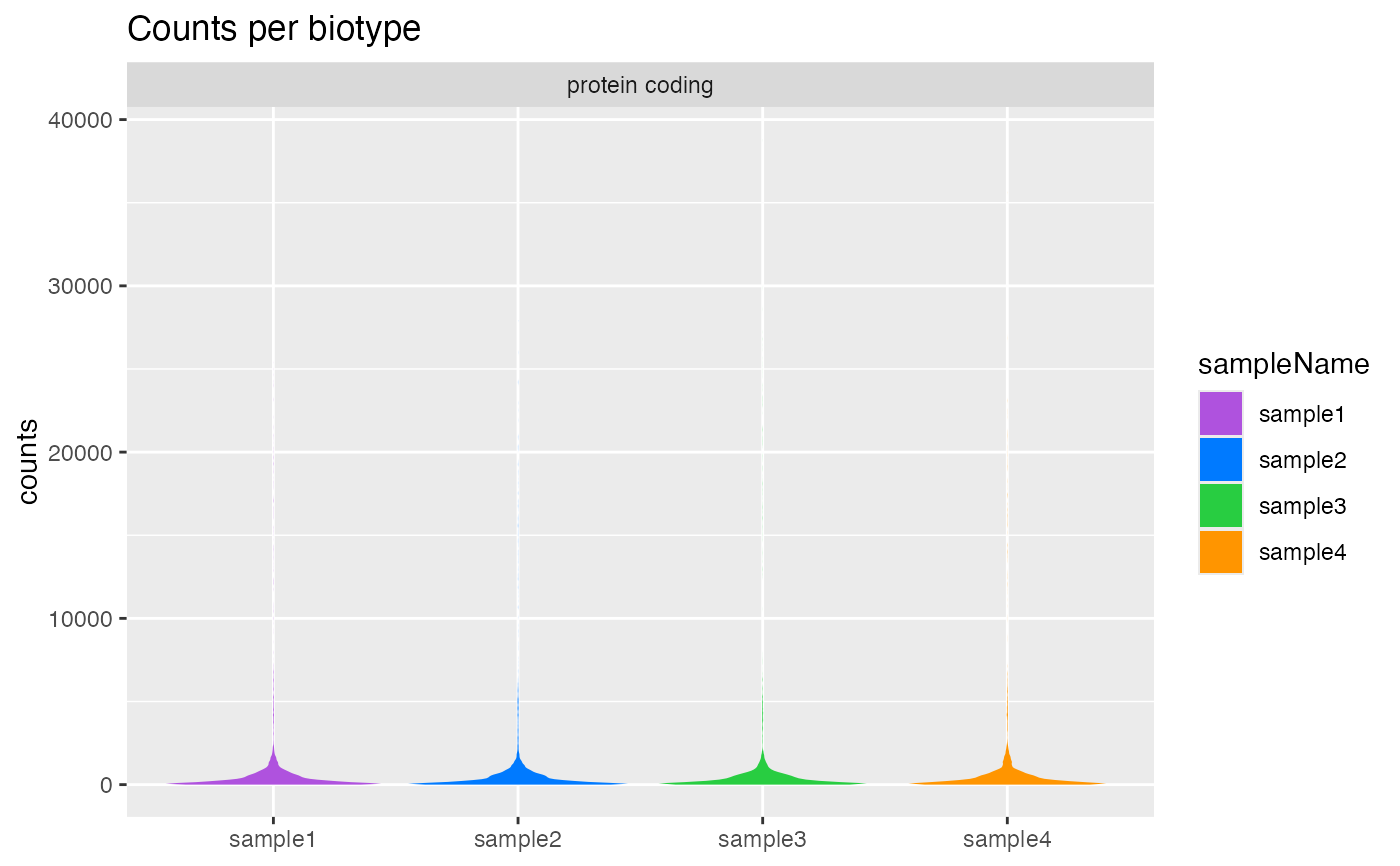
 ## SingleCellExperiment ====
object <- SingleCellExperiment_splatter
plotCountsPerBiotype(object)
#> ℹ 100 / 100 features passed `perRow` >= "1" cutoff.
## SingleCellExperiment ====
object <- SingleCellExperiment_splatter
plotCountsPerBiotype(object)
#> ℹ 100 / 100 features passed `perRow` >= "1" cutoff.