Plot counts correlation
Source:R/AllGenerics.R, R/plotCountsCorrelation-methods.R
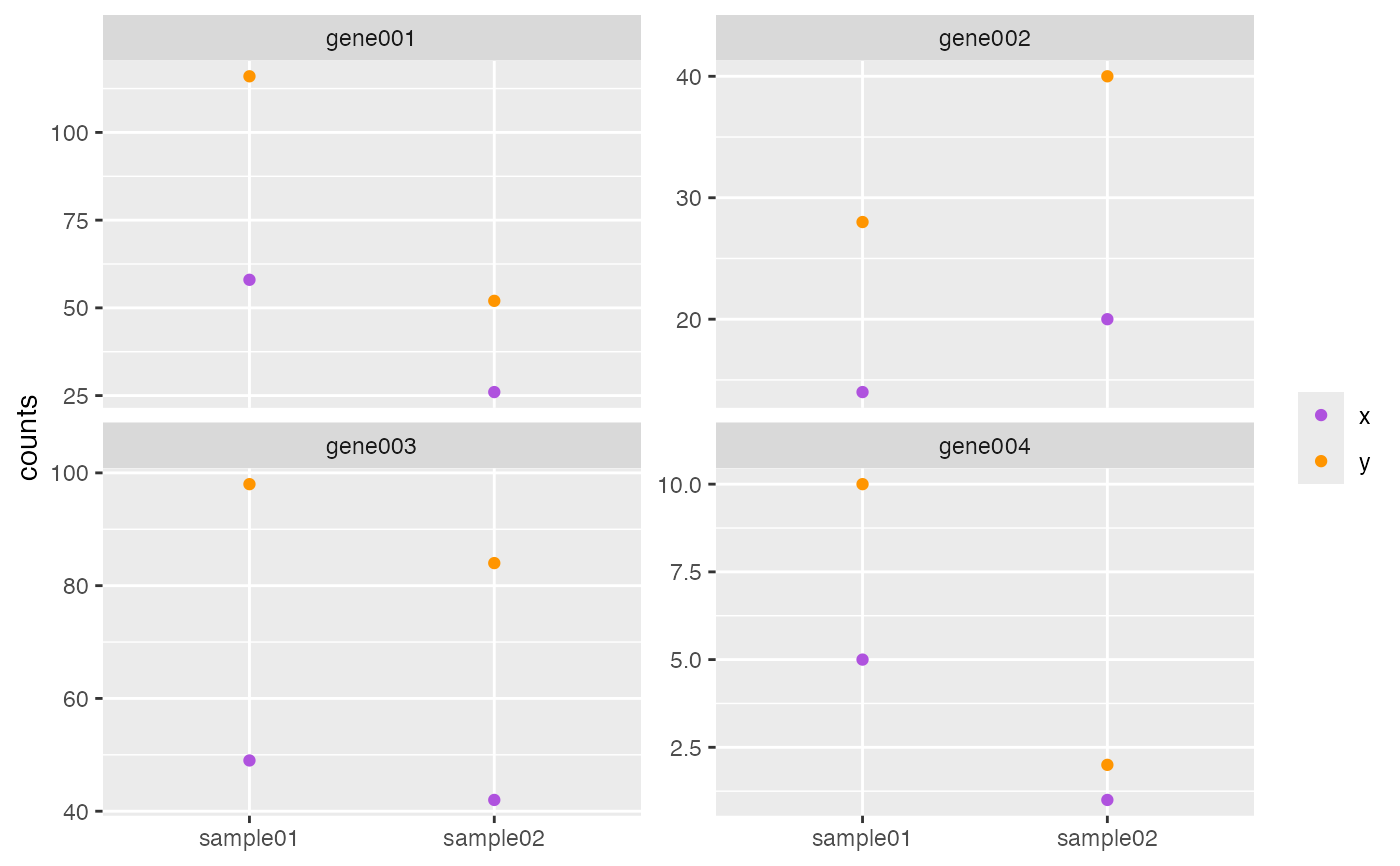
plotCountsCorrelation.RdCompare feature expression correlation across two data sets.
Usage
plotCountsCorrelation(x, y, ...)

# S4 method for class 'matrix,matrix'
plotCountsCorrelation(
  x,
  y,
  i = NULL,
  j = NULL,
  xName = "x",
  yName = "y",
  labels = list(title = NULL, subtitle = NULL, color = NULL, x = NULL, y = "counts")
)
Arguments
- x
Object.
- y
Object.
- i
Indices specifying elements to extract or replace. Indices are
numericorcharactervectors, empty (missing), orNULL.For more information:
- j
Indices specifying elements to extract or replace. Indices are
numericorcharactervectors, empty (missing), orNULL.For more information:
- xName, yName
character(1). Color legend name for value inxory.- labels
list. ggplot2 labels. Seeggplot2::labs()for details.- ...
Additional arguments.