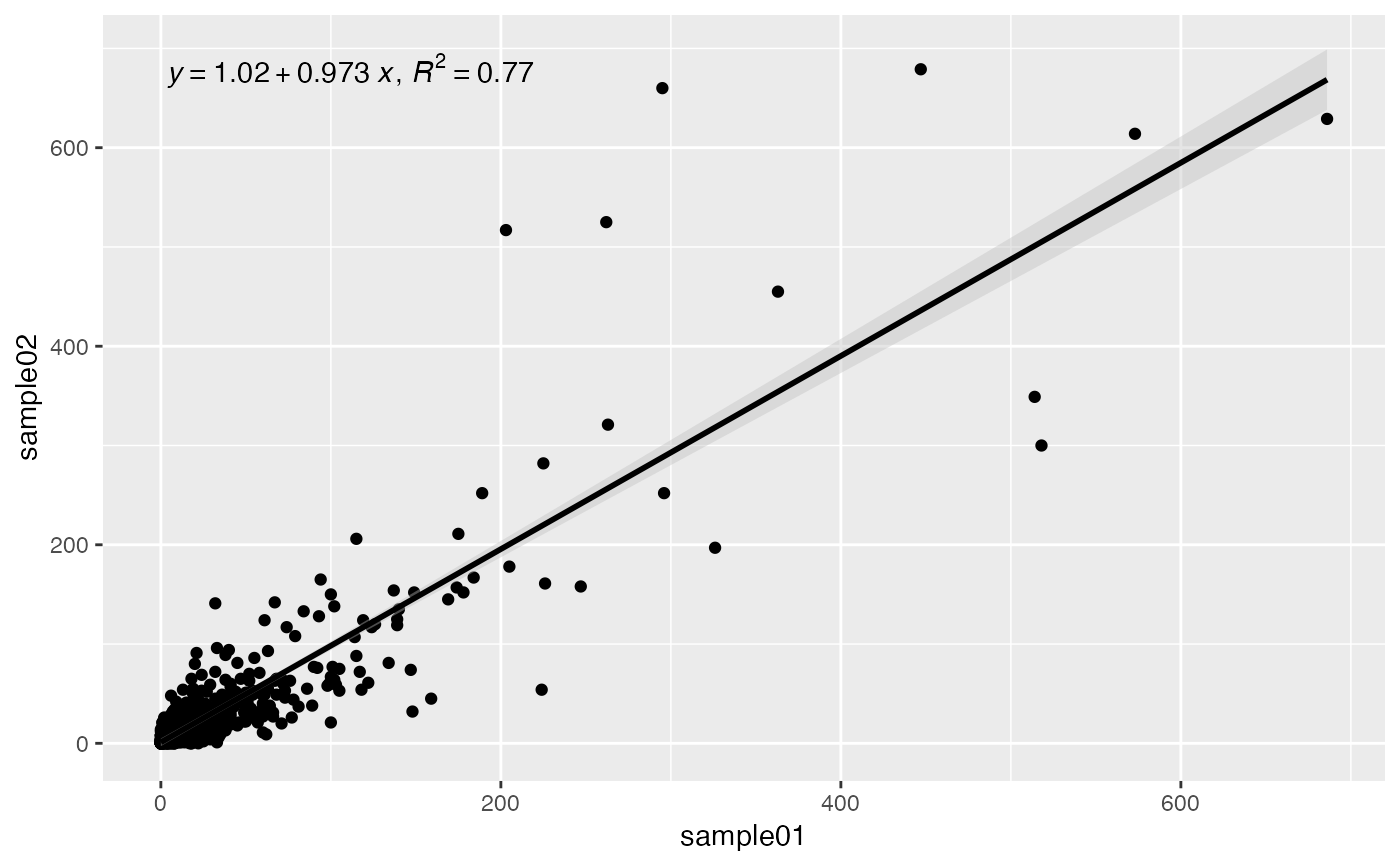
Correlation X-Y scatterplot
Usage
plotCorrelation(object, ...)

# S4 method for class 'DFrame'
plotCorrelation(
  object,
  xCol,
  yCol,
  pointLabelCol = NULL,
  labels = list(title = NULL, subtitle = NULL, x = NULL, y = NULL),
  trans = c("identity", "log10", "log2"),
  r2 = TRUE,
  se = TRUE,
  colors = list(dots = "black", line = "black", se = "gray")
)

# S4 method for class 'Matrix'
plotCorrelation(object, xCol, yCol, labelPoints = FALSE, ...)

# S4 method for class 'SummarizedExperiment'
plotCorrelation(object, assay = 1L, ...)

# S4 method for class 'data.frame'
plotCorrelation(
  object,
  xCol,
  yCol,
  pointLabelCol = NULL,
  labels = list(title = NULL, subtitle = NULL, x = NULL, y = NULL),
  trans = c("identity", "log10", "log2"),
  r2 = TRUE,
  se = TRUE,
  colors = list(dots = "black", line = "black", se = "gray")
)

# S4 method for class 'matrix'
plotCorrelation(object, xCol, yCol, labelPoints = FALSE, ...)
Arguments
- object
Object.
- xCol, yCol
character(1)orinteger(1). X and Y column name or position.- pointLabelCol
character(1)orNULL. Fordata.framemethod, which column name or position should be used to label points on the plot?- labels
list. ggplot2 labels. Seeggplot2::labs()for details.- trans
character(1). Name of the axis scale transformation to apply.For more information:
- r2
logical(1). Show information on thelmfit? This includes the equation, and the coefficient of determination (R^2). Refer toggpmisc::stat_poly_eqfor details.- se
logical(1). Display confidence interval around thelmfit line? Refer toggplot2::geom_smoothfor details.- colors
list(3). Named list defining the colors ofdots,line, andse, for confidence interval standard error.- labelPoints
logical(1). Formatrixmethod, label points on plot with row names?- ...
Additional arguments.
- assay
vector(1). Assay name or index position.
Correlation coefficient calculations
Correlation coefficient calcluations are generated by
ggpmisc::stat_poly_eq. Refer to the ggpmisc GitHub repo for details.
Examples
data(RangedSummarizedExperiment, package = "AcidTest")

## SummarizedExperiment ====
object <- RangedSummarizedExperiment
plotCorrelation(
    object = object,
    xCol = 1L,
    yCol = 2L,
    trans = "identity"
)