Plot cell types per cluster
Source:R/AllGenerics.R, R/plotCellTypesPerCluster-methods.R
plotCellTypesPerCluster.RdPlot cell types per cluster
Usage
plotCellTypesPerCluster(object, markers, ...)

# S4 method for class 'SingleCellExperiment,KnownMarkers'
plotCellTypesPerCluster(
  object,
  markers,
  min = 1L,
  max = Inf,
  reduction = "UMAP",
  expression = c("mean", "sum"),
  headerLevel = 2L,
  ...
)
Arguments
- object
Object.
- markers
Object containing gene markers.
- min
numeric(1). Recommended minimum value cutoff.- max
numeric(1). Recommended maximum value cutoff.- reduction
vector(1). Dimension reduction name or index position.- expression
character(1). Calculation to apply. Usesmatch.arg()internally and defaults to the first argument in thecharactervector.- headerLevel
integer(1)(1-7). Markdown header level.- ...
Passthrough arguments to
plotMarker().
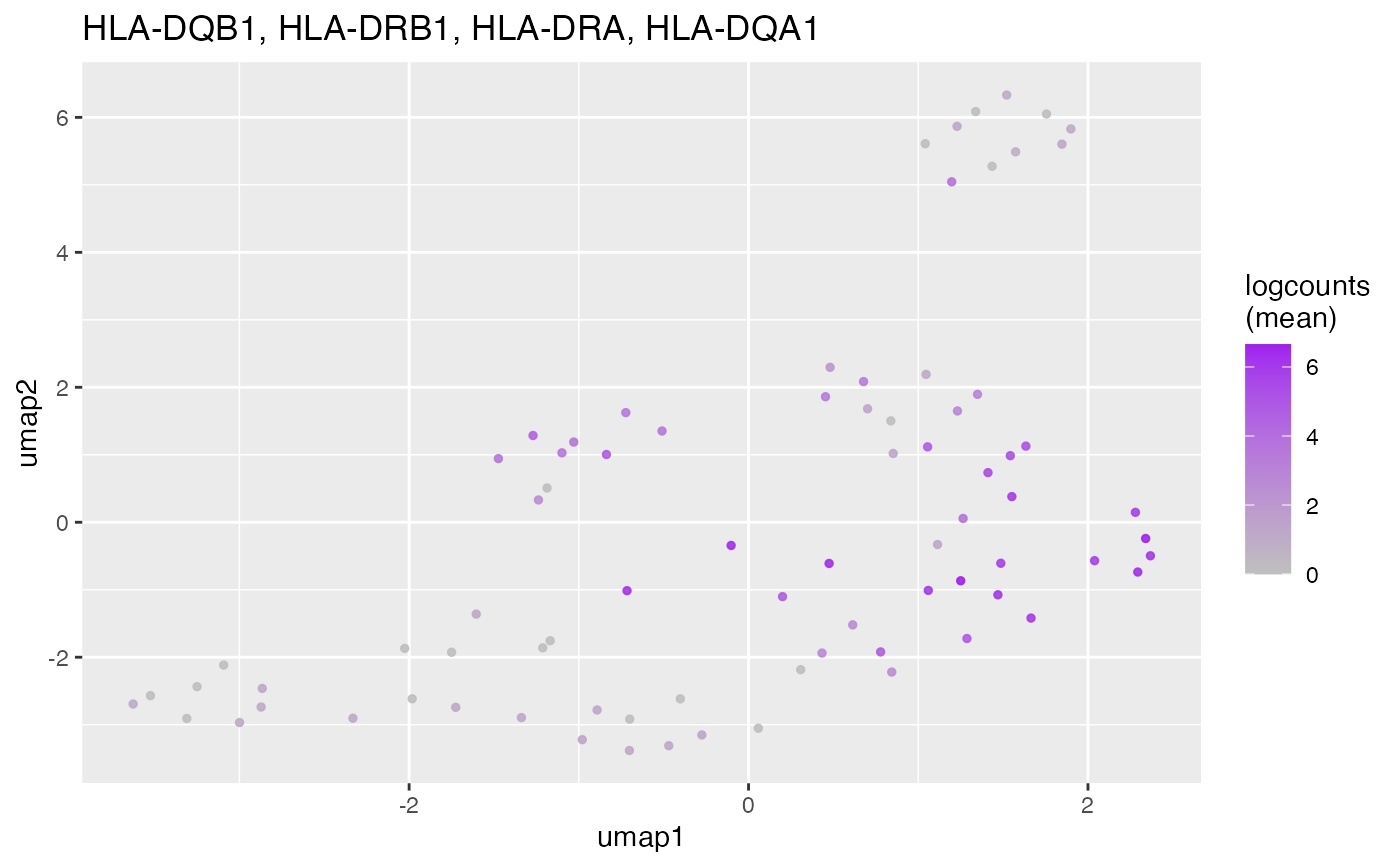
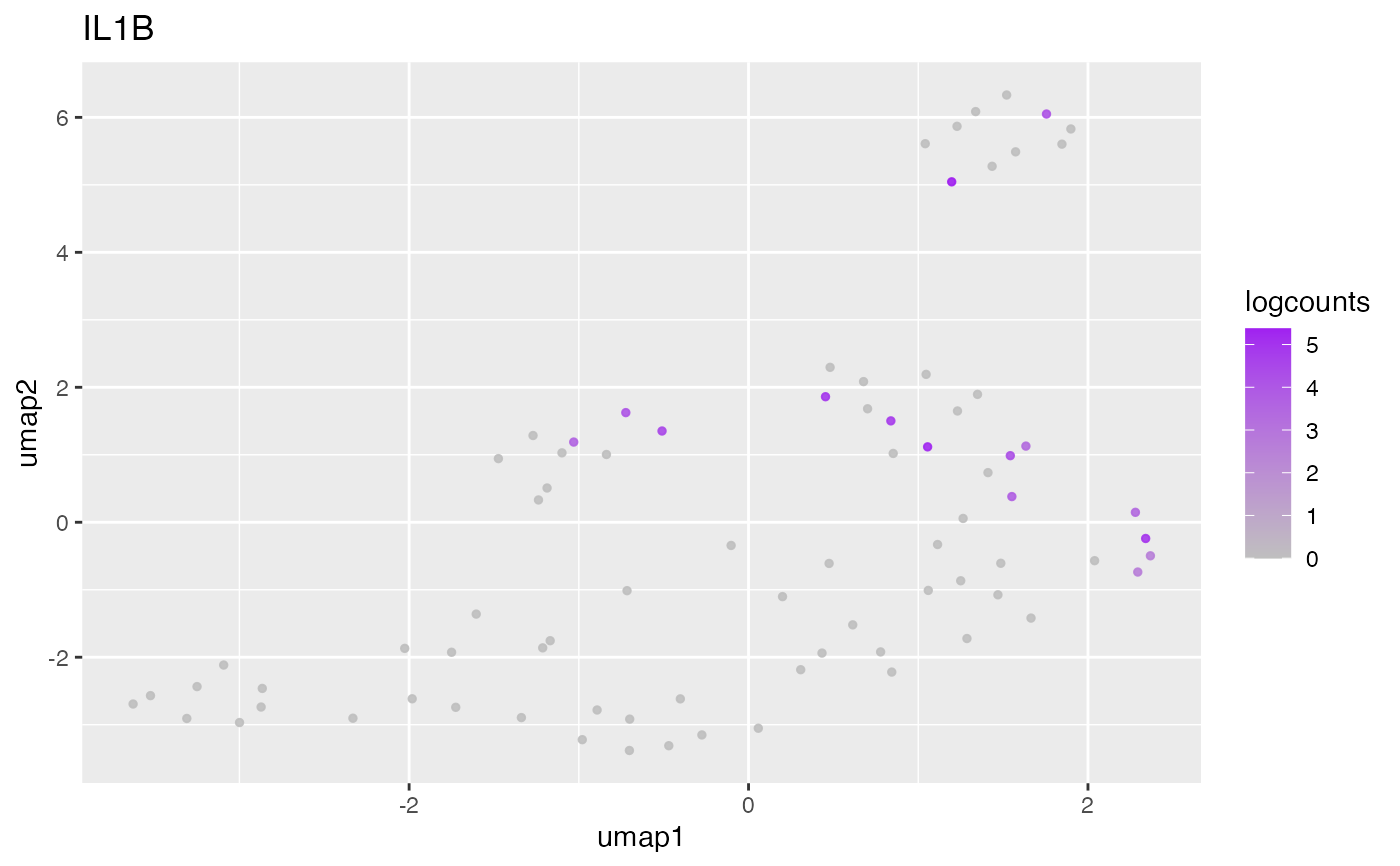
Details
Plot the geometric mean of the significant marker genes for every known cell
type (per unbiased cluster). Cell types with too few (min cutoff) or too
many (max cutoff) marker genes will be skipped.
Examples
data(
    KnownMarkers,
    SingleCellExperiment_Seurat,
    package = "AcidTest"
)

## SingleCellExperiment ====
object <- SingleCellExperiment_Seurat
markers <- KnownMarkers
plotCellTypesPerCluster(
    object = object,
    markers = markers,
    reduction = "UMAP"
)
#>
#>
#> ## Cluster 1 {.tabset}
#>
#>
#>
#> ### Macrophage
#>

#>
#>
#> ## Cluster 2 {.tabset}
#>
#>
#>
#> ### Dendritic Cell
#>
#>
#>
#> ## Cluster 2 {.tabset}
#>
#>
#>
#> ### Dendritic Cell
#>