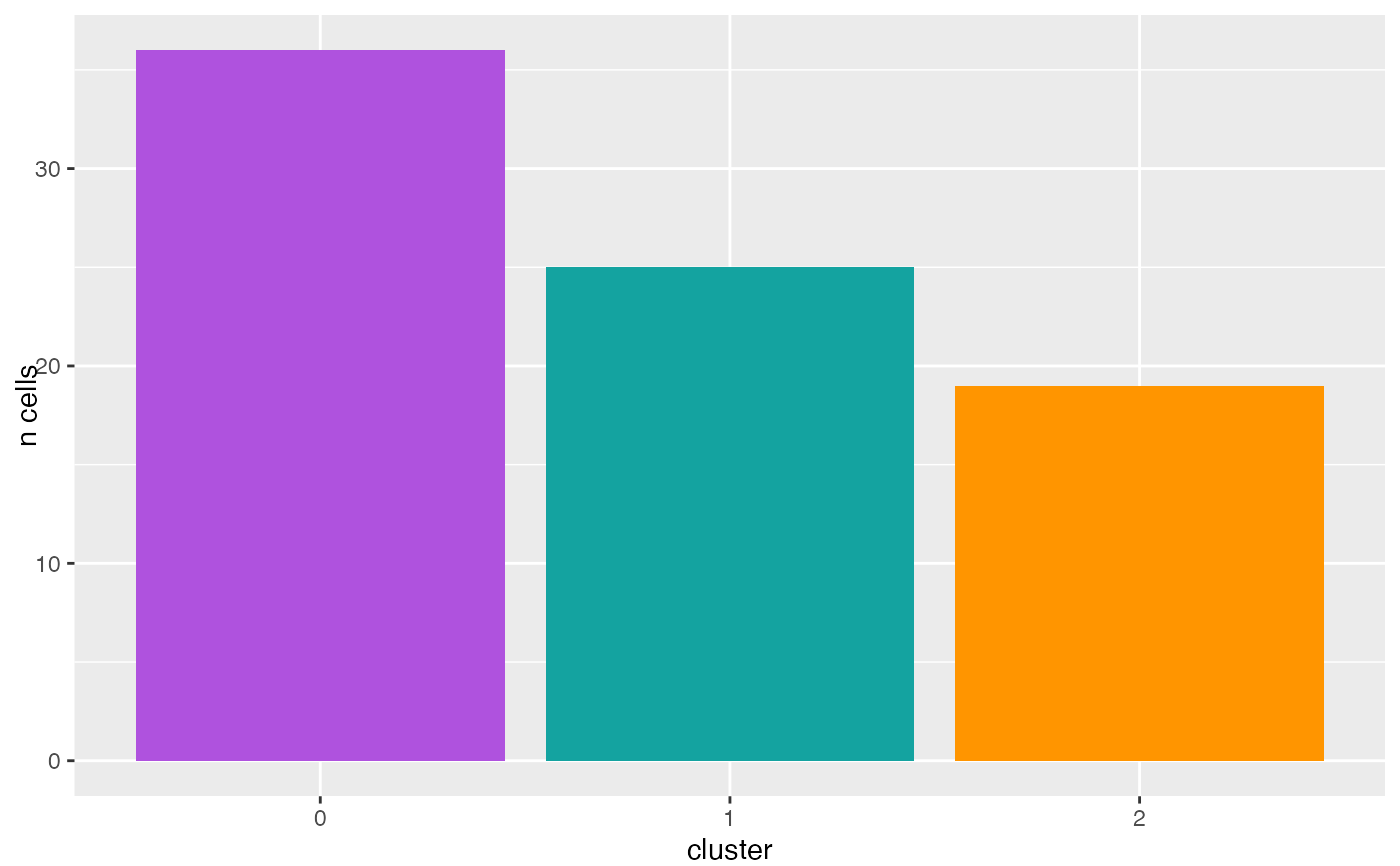
Plot cell counts per cluster
Source:R/AllGenerics.R, R/plotCellCountsPerCluster-methods.R
plotCellCountsPerCluster.RdPlot cell counts per cluster
Usage
plotCellCountsPerCluster(object, ...)

# S4 method for class 'SingleCellExperiment'
plotCellCountsPerCluster(object, interestingGroups = NULL)Examples
data(SingleCellExperiment_Seurat, package = "AcidTest")

## SingleCellExperiment ====
object <- SingleCellExperiment_Seurat
plotCellCountsPerCluster(object)