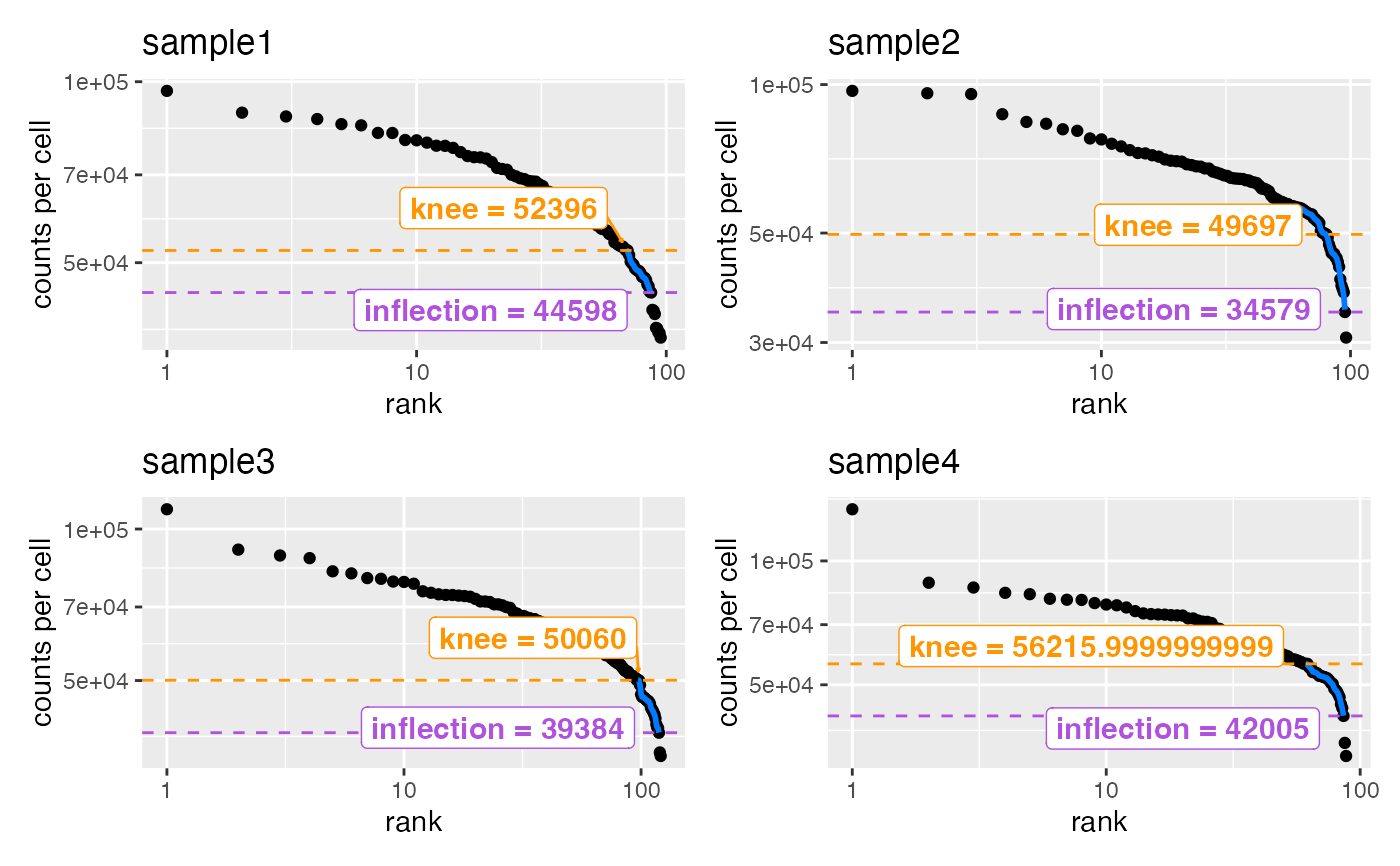
Plot barcode ranks
Usage
plotBarcodeRanks(object, ...)

# S4 method for class 'SingleCellExperiment'
plotBarcodeRanks(
  object,
  colors = c(fitline = AcidPlots::lightPalette[["blue"]], inflection =
    AcidPlots::lightPalette[["purple"]], knee = AcidPlots::lightPalette[["orange"]]),
  labels = list(title = NULL, subtitle = NULL),
  ...
)
Arguments
- object
Object.
- colors
character(3). Character vector denotingfitline,inflection, andkneepoint colors. Must pass in color names or hexadecimal values.- labels
list. ggplot2 labels. Seeggplot2::labs()for details.- ...
Passthrough to
barcodeRanksPerSample().
Examples
data(SingleCellExperiment_splatter, package = "AcidTest")

## SingleCellExperiment ====
if (requireNamespace("DropletUtils", quietly = TRUE)) {
    object <- SingleCellExperiment_splatter
    plotBarcodeRanks(object)
}