R/ggplot2-transforms.R
acid_scale_y_continuous_nopad.Rd
Remove Y axis padding
acid_scale_y_continuous_nopad()
ggproto.
ggproto
Updated 2023-08-11.
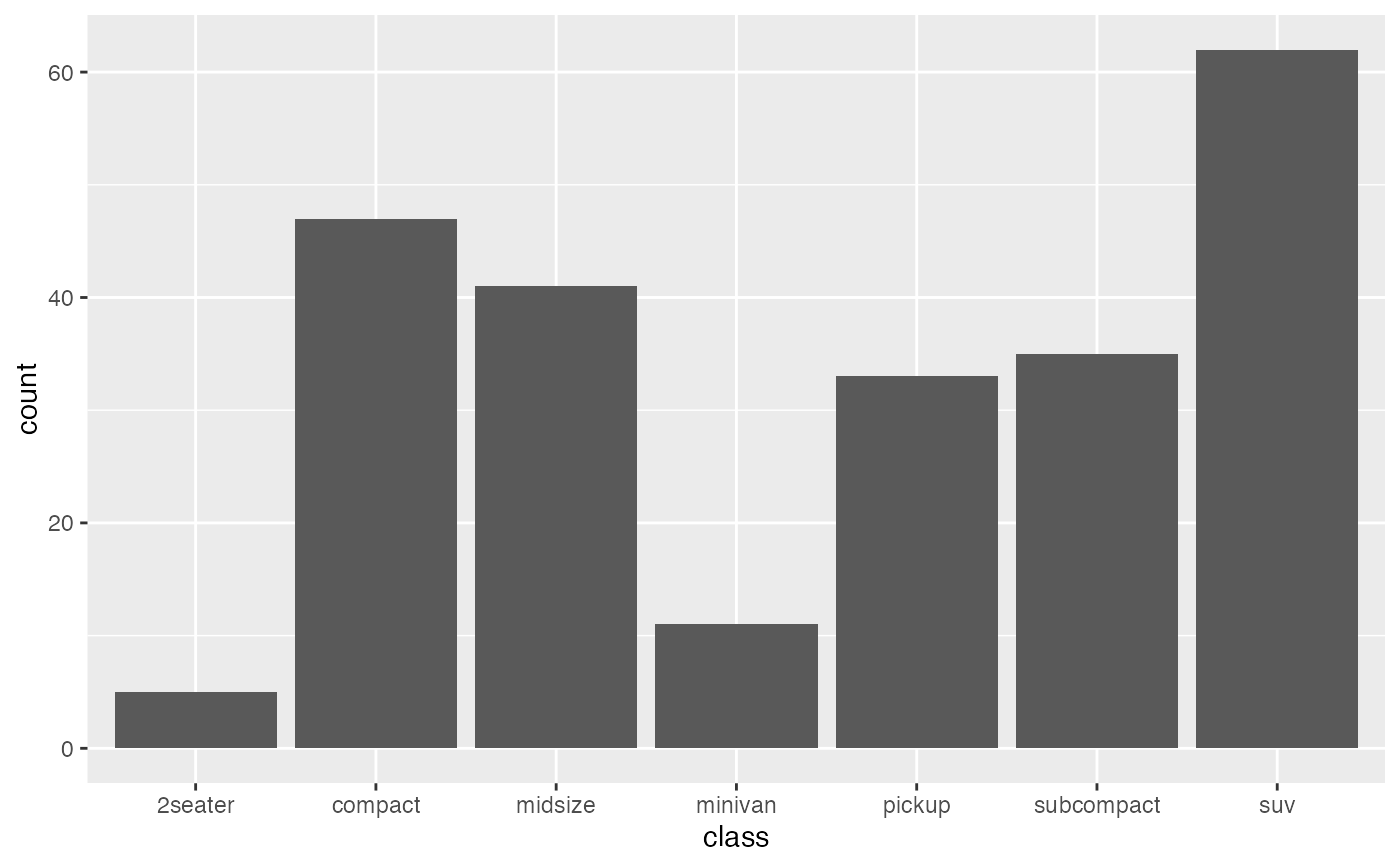
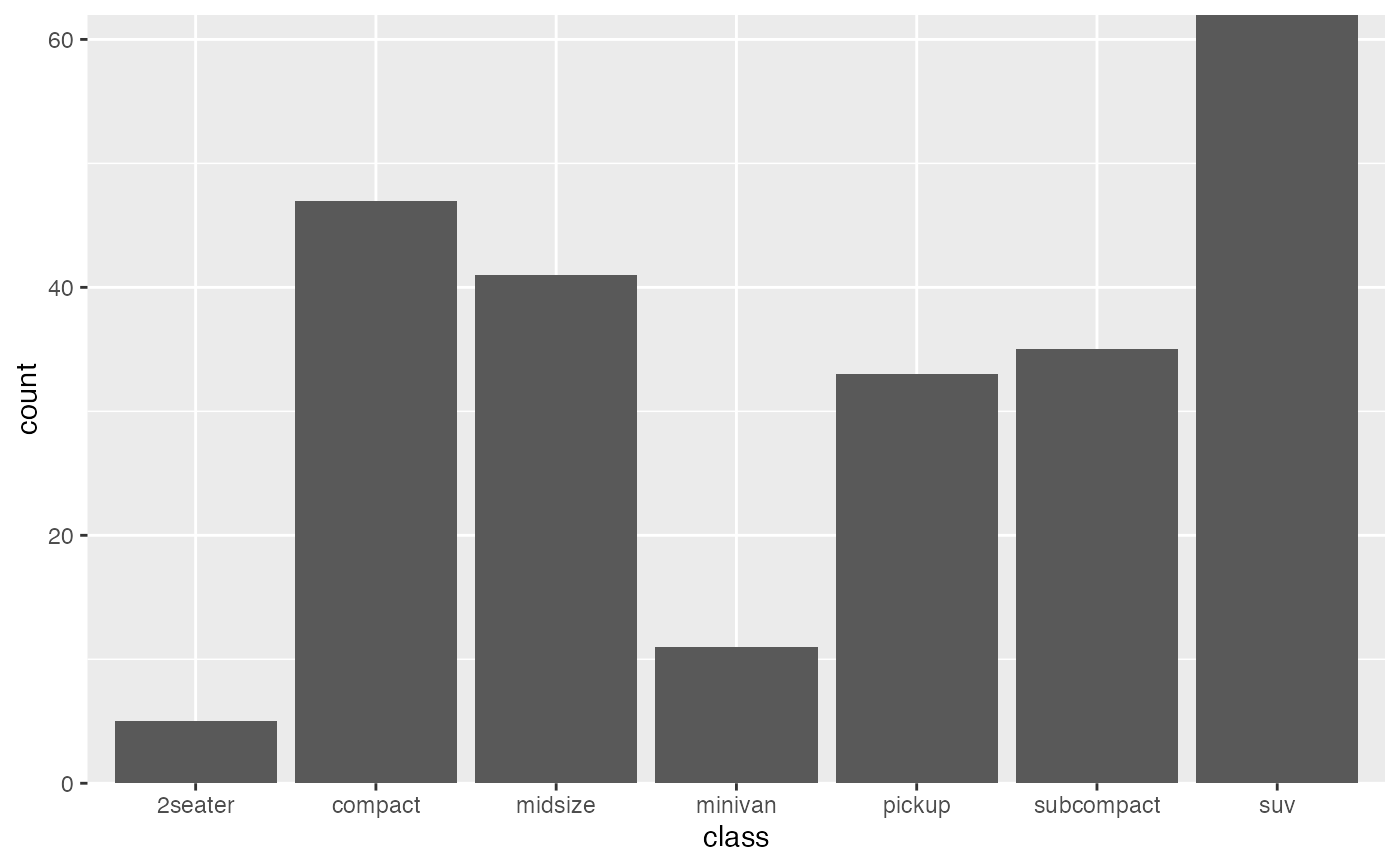
library(ggplot2)
g <- ggplot(data = mpg, aes(x = class)) +
    geom_bar()
## By default, plots contain padding at the top of the graph.
print(g)

## This function will automatically remove the padding.
g + acid_scale_y_continuous_nopad()