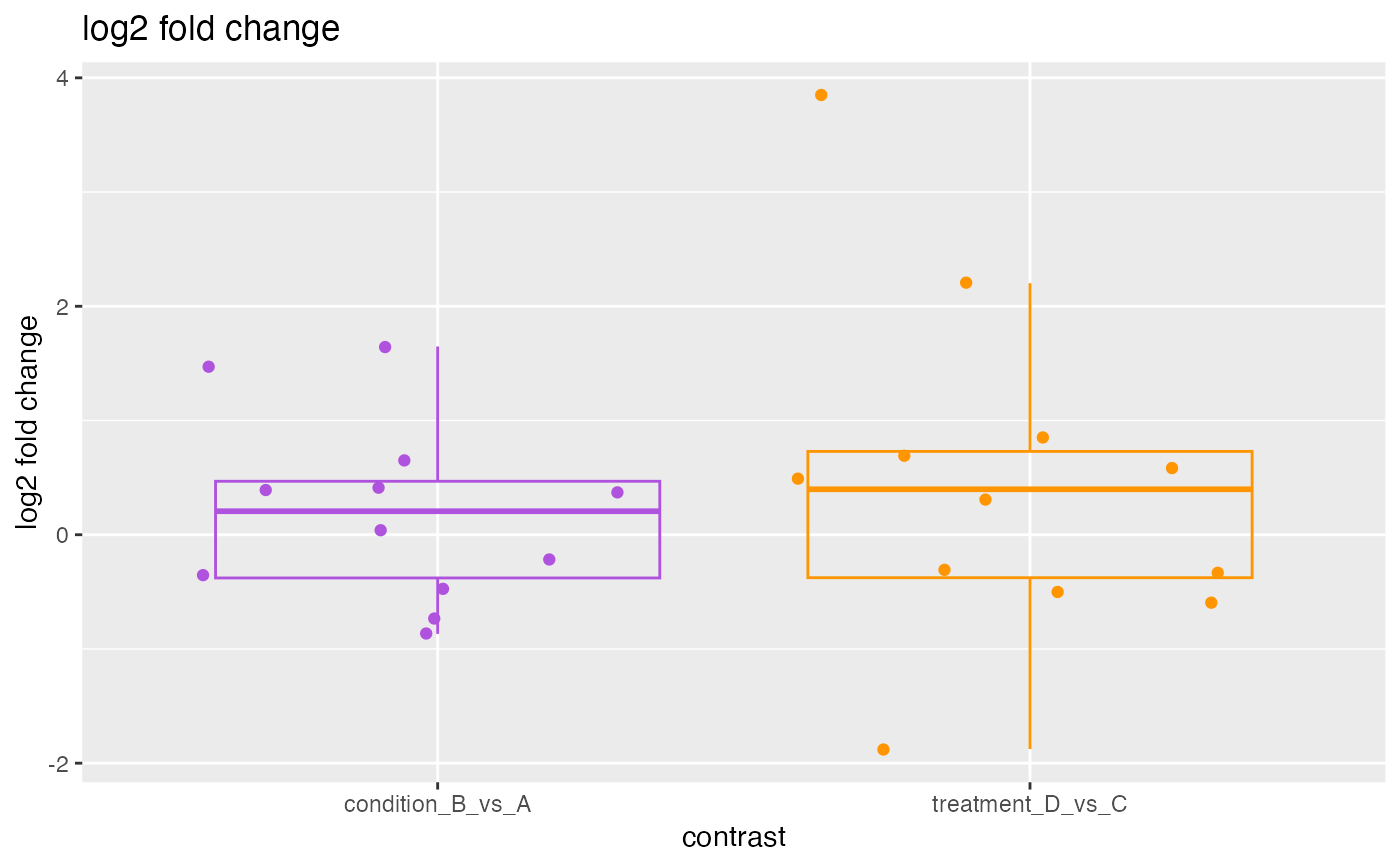
Plot log2 fold change distributions
Arguments
- object
Object.
- contrast
characterorNULL. Contrast name. IfNULL, plot all contrasts.- collection
character(1). Gene set collection name. Typically refers toh(hallmark),c1-c7collections from MSigDb. Can obtain usingcollectionNames()onFgseaListobject.- set
character(1). Gene set name, in a definedcollection. For example,"HALLMARK_ADIPOGENESIS".- geom
character(1). Plot type. Usesmatch.arg()internally and defaults to the first argument in thecharactervector.- points
logical(1). Show individual data points.- labels
list. ggplot2 labels. Seeggplot2::labs()for details.- ...
Additional arguments.
Examples
data(fgsea)

## FgseaList ====
object <- fgsea
collection <- collectionNames(object)[[1L]]
set <- geneSetNames(object = object, collection = collection)[[1L]]
plotLfc(
    object = object,
    collection = collection,
    set = set
)