Heatmap
Usage
plotHeatmap(object, ...)

# S4 method for class 'FgseaList'
plotHeatmap(
  object,
  contrast,
  contrastSamples = TRUE,
  collection,
  set,
  leadingEdge = FALSE,
  ...
)
Arguments
- object
Object.
- contrast
character(1). Contrast name.- contrastSamples
logical(1). Only visualize the samples defined in the contrast.- collection
character(1). Gene set collection name. Typically refers toh(hallmark),c1-c7collections from MSigDb. Can obtain usingcollectionNames()onFgseaListobject.- set
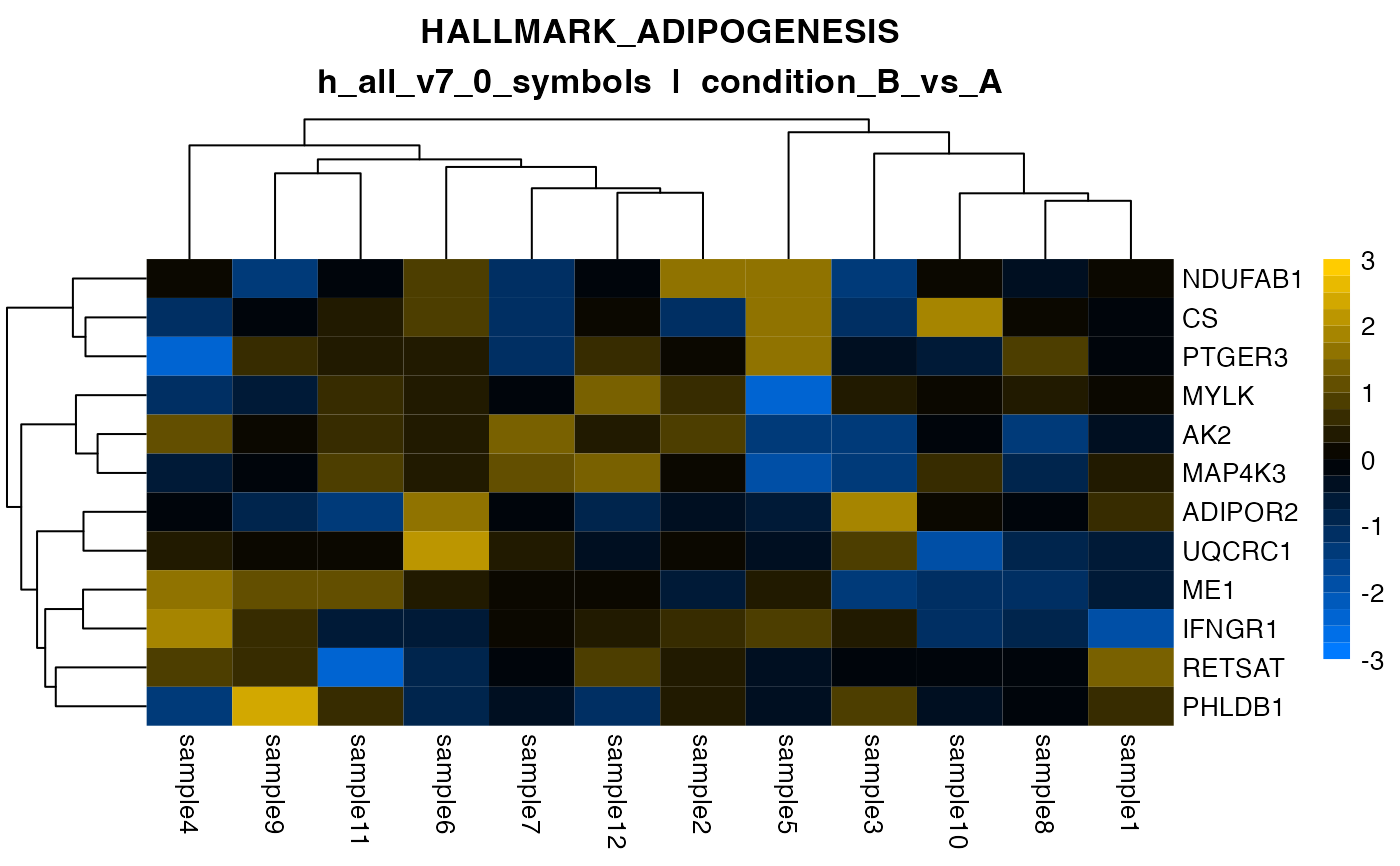
character(1). Gene set name, in a definedcollection. For example,"HALLMARK_ADIPOGENESIS".- leadingEdge
logical(1). Visualize only the leading edge genes returned by GSEA. IfFALSE, plot all genes in the gene set.- ...
Additional arguments.
Examples
data(fgsea)

## FgseaList ====
object <- fgsea
contrast <- contrastNames(object)[[1L]]
collection <- collectionNames(object)[[1L]]
set <- geneSetNames(object = object, collection = collection)[[1L]]
plotHeatmap(
    object = object,
    contrast = contrast,
    collection = collection,
    set = set
)
#> Contrast: condition_B_vs_A
#> Factor column: condition
#> Numerator samples: "sample7", "sample8", "sample9", "sample10", "sample11"...
#> Denominator samples: "sample1", "sample2", "sample3", "sample4", "sample5"...
#> → Scaling matrix per row (z-score).
#> → Performing hierarchical clustering with `hclust()` method "ward.D2".