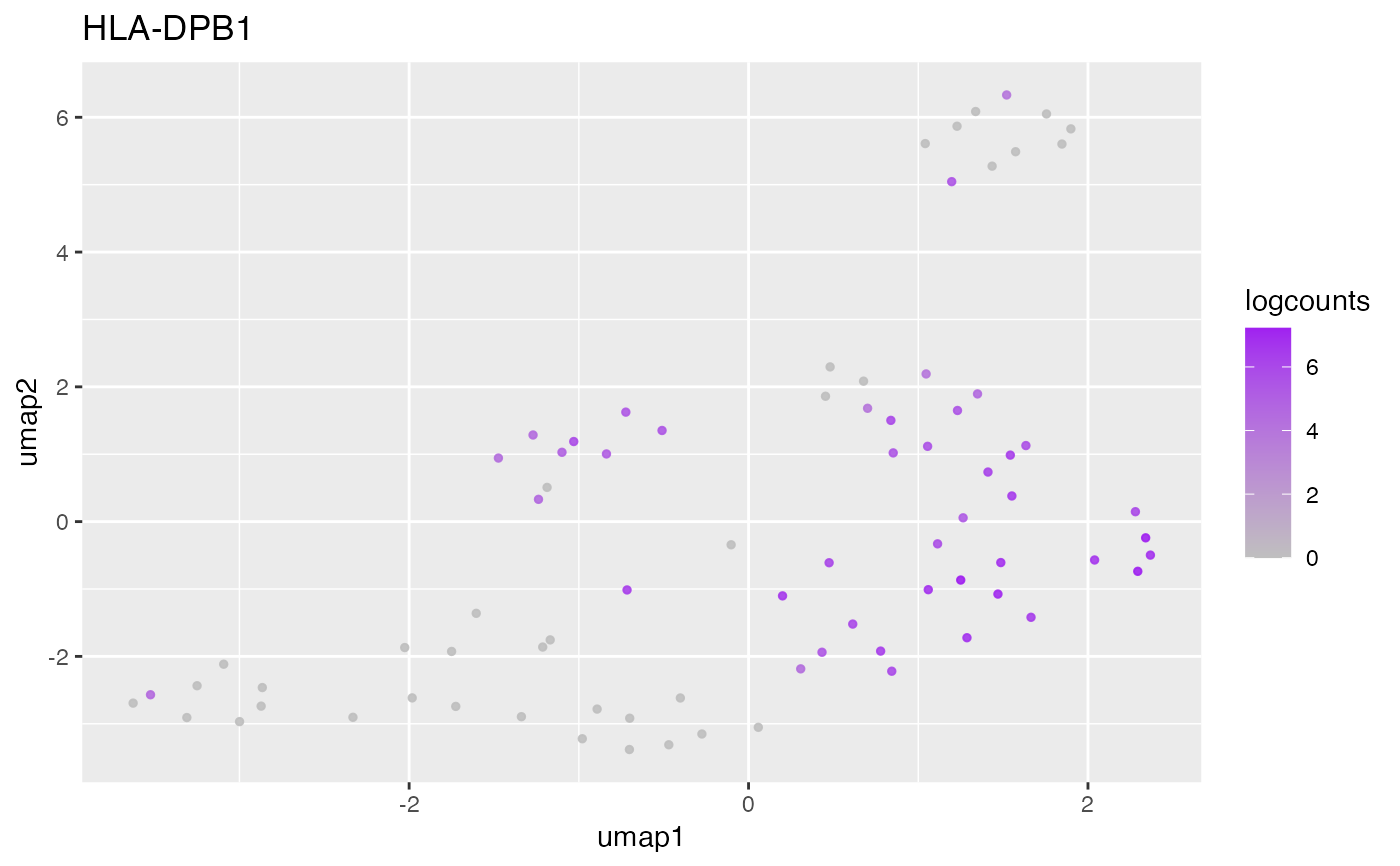
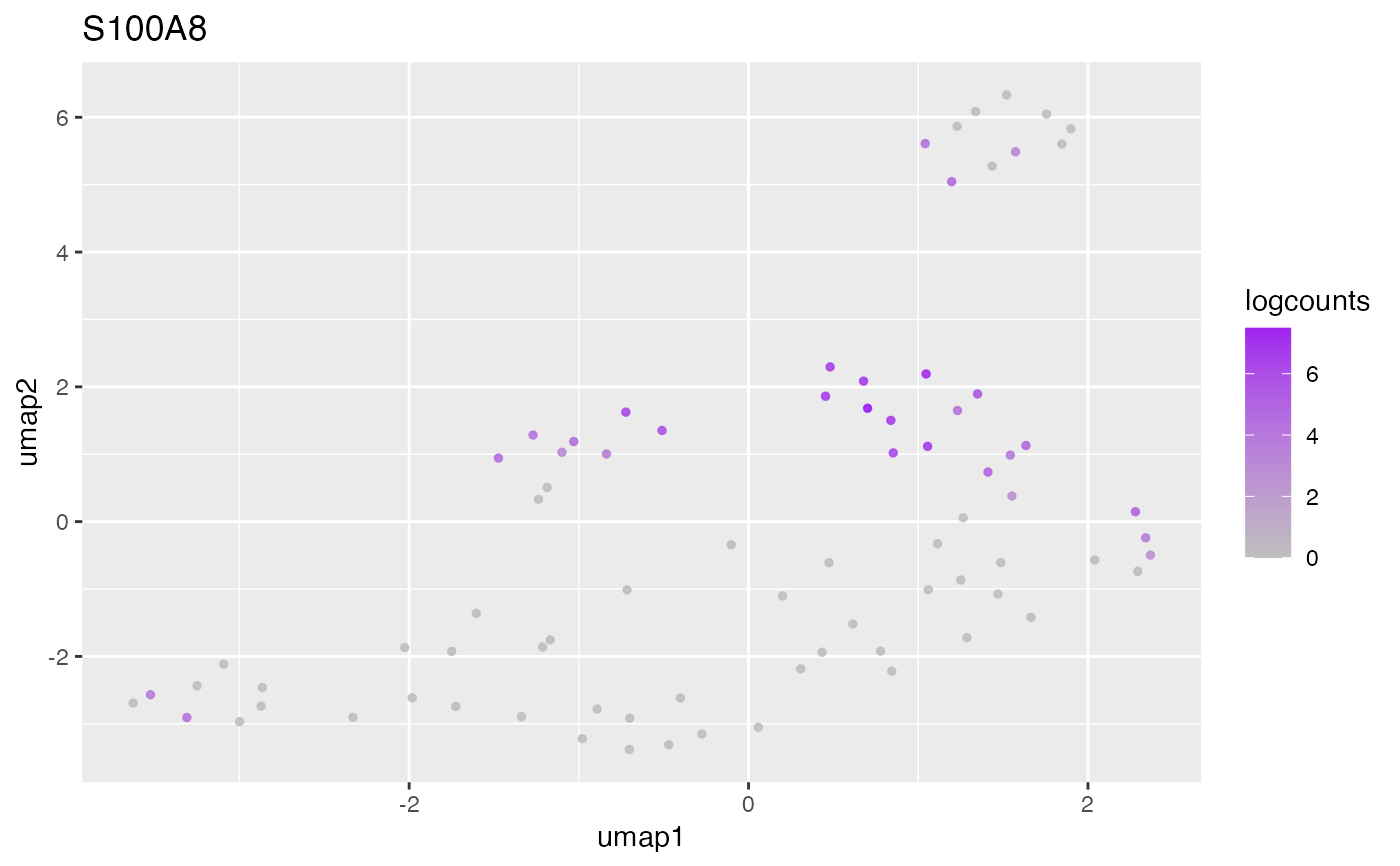
Plot top markers
Arguments
- object
Object.
- markers
Object containing cell marker expression data.
- direction
character(1). Whether to include upregulated ("up"; positive LFC), downregulated ("down"; negative LFC) or"both"directions of association per cluster.- reduction
vector(1). Dimension reduction name or index position.- n
integer(1). Number of genes per cluster.- headerLevel
integer(1)(1-7). Markdown header level.- ...
Passthrough arguments to
plotMarker().- BPPARAM
bpparamClass. BiocParallel parameter to specify the desired processor configuration.
We recommend using one of the following:
Details
The number of markers to plot is determined by the output of the
topMarkers() function. If you want to reduce the number of genes to plot,
simply reassign first using that function. If necessary, we can add support
for the number of genes to plot here in a future update.
Examples
data(Seurat, SeuratMarkersPerCluster, package = "AcidTest")
## Seurat, SeuratMarkersPerCluster ====
object <- Seurat
markers <- SeuratMarkersPerCluster
plotTopMarkers(
object = object,
markers = markers,
reduction = "UMAP"
)
#> ℹ Including both up- and down-regulated markers.
#>
#>
#> ## Cluster 0 {.tabset}
#>
 #>
#>
#> ## Cluster 1 {.tabset}
#>
#>
#>
#> ## Cluster 1 {.tabset}
#>
 #>
#>
#> ## Cluster 2 {.tabset}
#>
#>
#>
#> ## Cluster 2 {.tabset}
#>
