Volcano plot
Usage
plotVolcano(object, ...)

# S4 method for class 'DESeqAnalysis'
plotVolcano(
  object,
  i,
  alphaThreshold = NULL,
  baseMeanThreshold = NULL,
  lfcThreshold = NULL,
  genes = NULL,
  ntop = 0L,
  ...
)

# S4 method for class 'DESeqResults'
plotVolcano(
  object,
  direction = c("both", "up", "down"),
  alphaThreshold = NULL,
  baseMeanThreshold = NULL,
  lfcThreshold = NULL,
  genes = NULL,
  ntop = 0L,
  pointColor = c(downregulated = AcidPlots::lightPalette[["purple"]], upregulated =
    AcidPlots::lightPalette[["orange"]], nonsignificant =
    AcidPlots::lightPalette[["gray"]]),
  pointSize = 2L,
  pointAlpha = 0.8,
  limits = list(x = NULL, y = c(1e-10, 1L)),
  labels = list(title = TRUE, subtitle = NULL),
  histograms = FALSE
)
Arguments
- object
Object.
- i
Indices specifying elements to extract or replace. Indices are
numericorcharactervectors, empty (missing), orNULL.For more information:
- alphaThreshold
numeric(1)orNULL. Adjusted P value ("alpha") cutoff. If leftNULL, will use the cutoff defined in the object.- baseMeanThreshold
numeric(1)orNULL. Base mean (i.e. average expression across all samples) threshold. If leftNULL, will use the cutoff defined in the object. Applies in general to DESeq2 RNA-seq differential expression output.- lfcThreshold
numeric(1)orNULL. Log (base 2) fold change ratio cutoff threshold. If leftNULL, will use the cutoff defined in the object.- genes
character. Gene identifiers.- ntop
integer(1). Number of top features to label.- ...
Additional arguments.
- direction
character(1). Include"both","up", or"down"directions.- pointColor
character(1). Default point color for the plot.- pointSize
numeric(1). Point size for dots in the plot. In the range of 1-3 is generally recommended.- pointAlpha
numeric(1)(0-1). Alpha transparency level.- limits
list(2). Named list containing"x"and"y"that define the lower and upper limits for each axis. Set automatically by default when leftNULL.- labels
list. ggplot2 labels. Seeggplot2::labs()for details.- histograms
logical(1). Show LFC and P value histograms.
Functions
plotVolcano(DESeqAnalysis): Passes toDESeqResultsmethod, withgene2symbolargument automatically defined.
Examples
data(deseq)
## Get genes from DESeqDataSet.
dds <- as.DESeqDataSet(deseq)
genes <- head(rownames(dds))
print(genes)
#> [1] "gene1" "gene2" "gene3" "gene4" "gene5" "gene6"
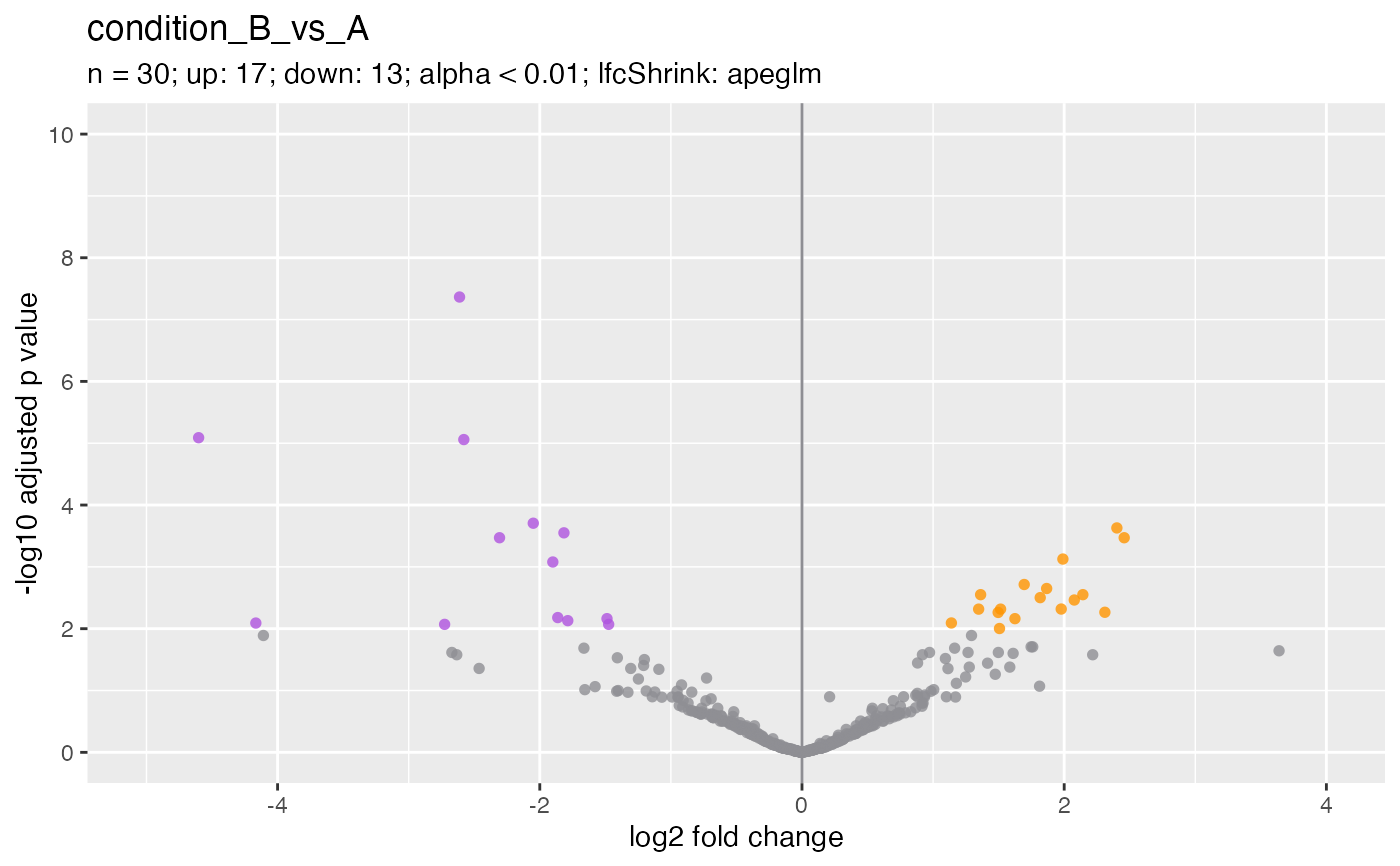
## DESeqAnalysis ====
object <- deseq
plotVolcano(object, i = 1L)
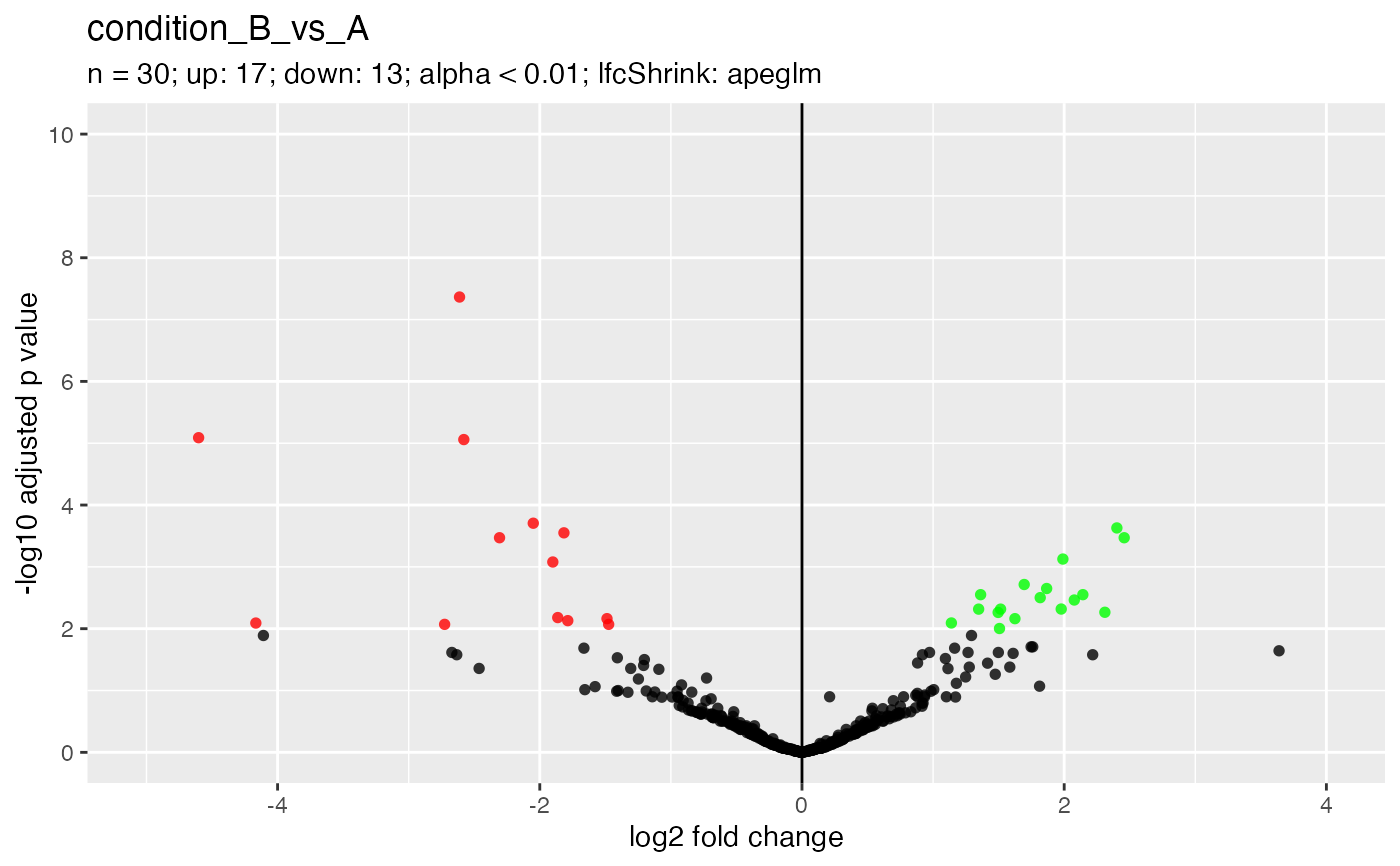
 ## Customize the colors.
plotVolcano(
object = object,
i = 1L,
pointColor = c(
downregulated = "red",
nonsignificant = "black",
upregulated = "green"
)
)
## Customize the colors.
plotVolcano(
object = object,
i = 1L,
pointColor = c(
downregulated = "red",
nonsignificant = "black",
upregulated = "green"
)
)
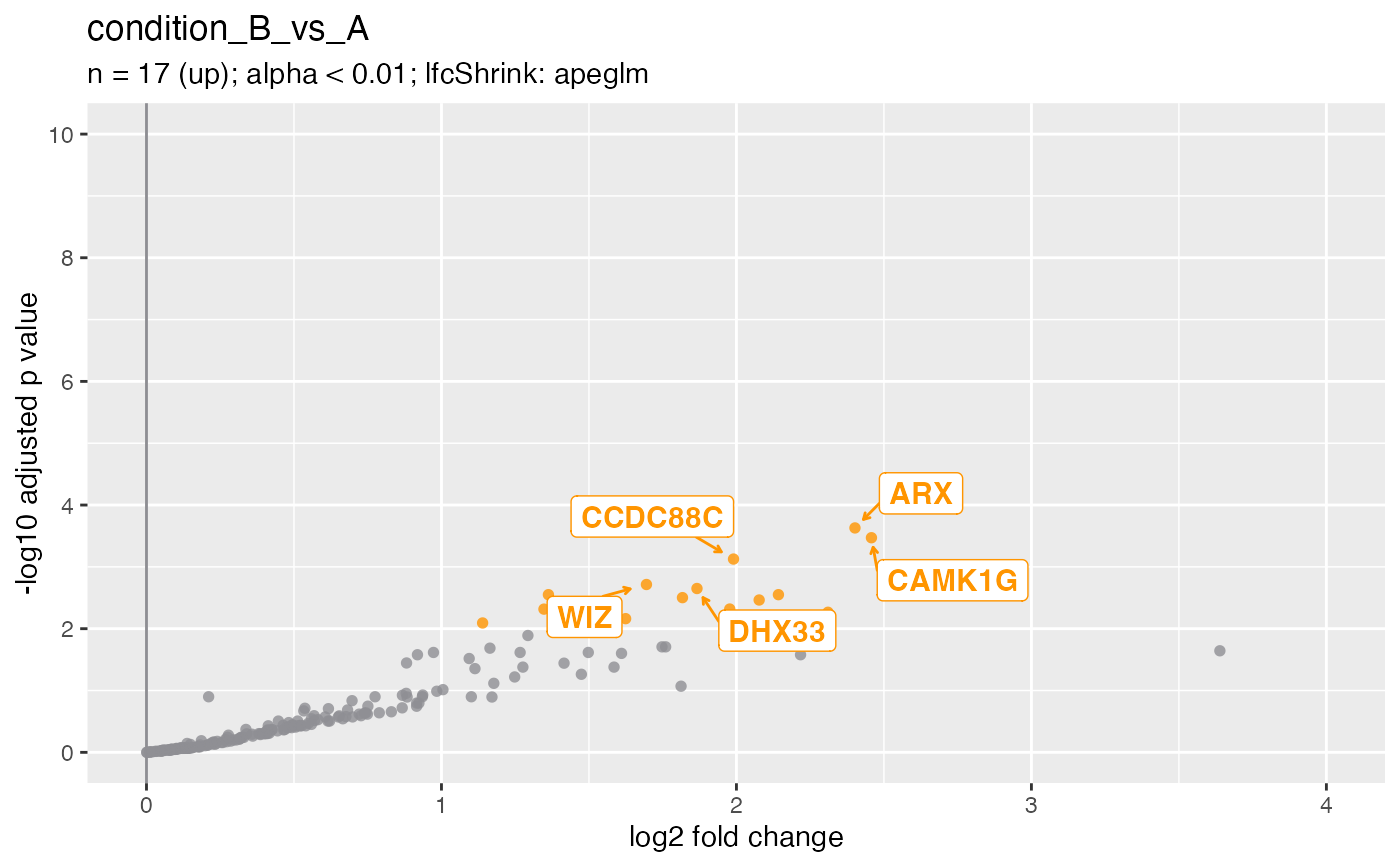
 ## Directional support (up or down).
plotVolcano(
object = object,
i = 1L,
direction = "up",
ntop = 5L
)
#> ℹ Labeling 5 genes in plot.
## Directional support (up or down).
plotVolcano(
object = object,
i = 1L,
direction = "up",
ntop = 5L
)
#> ℹ Labeling 5 genes in plot.
 plotVolcano(
object = object,
i = 1L,
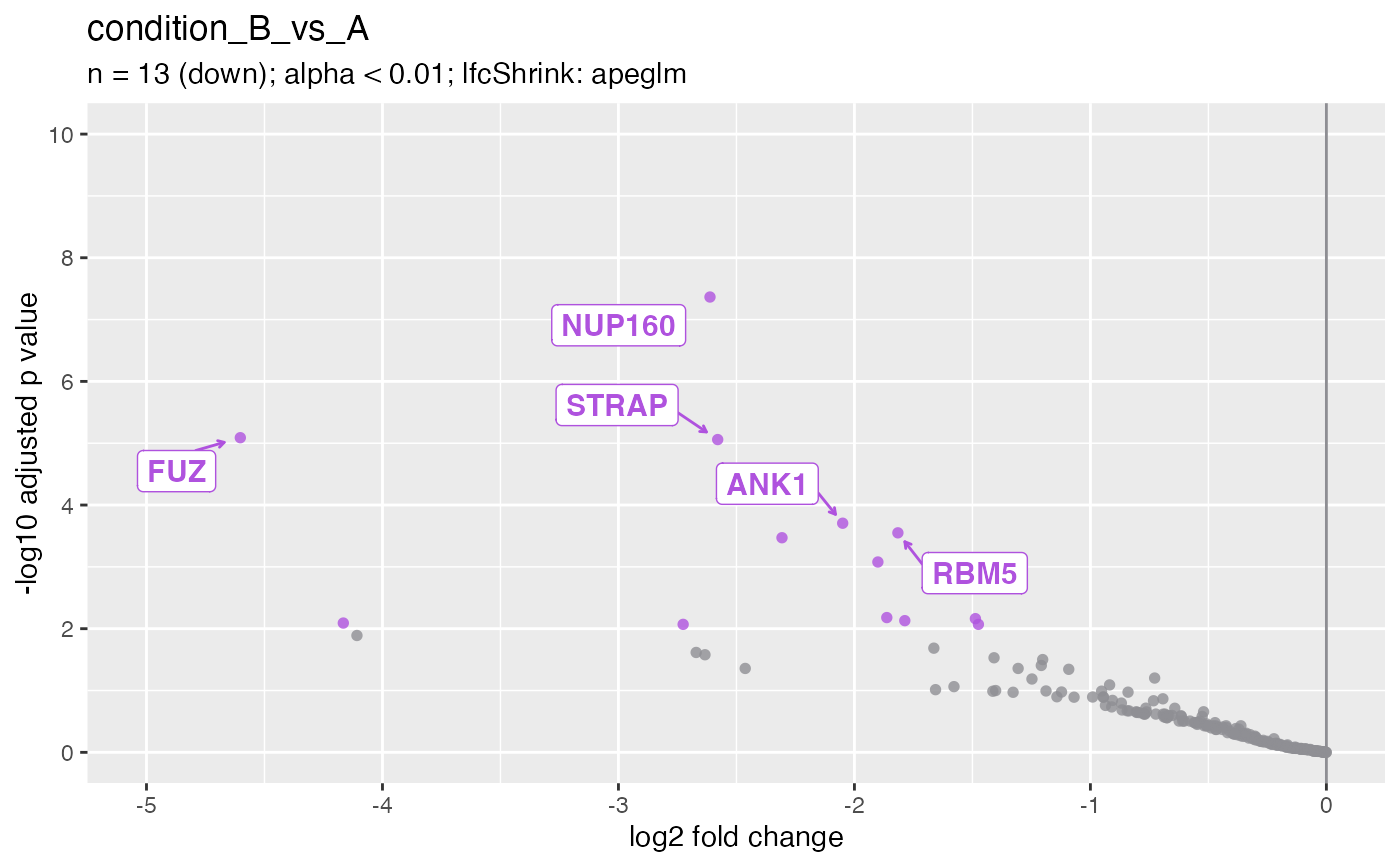
direction = "down",
ntop = 5L
)
#> ℹ Labeling 5 genes in plot.
plotVolcano(
object = object,
i = 1L,
direction = "down",
ntop = 5L
)
#> ℹ Labeling 5 genes in plot.
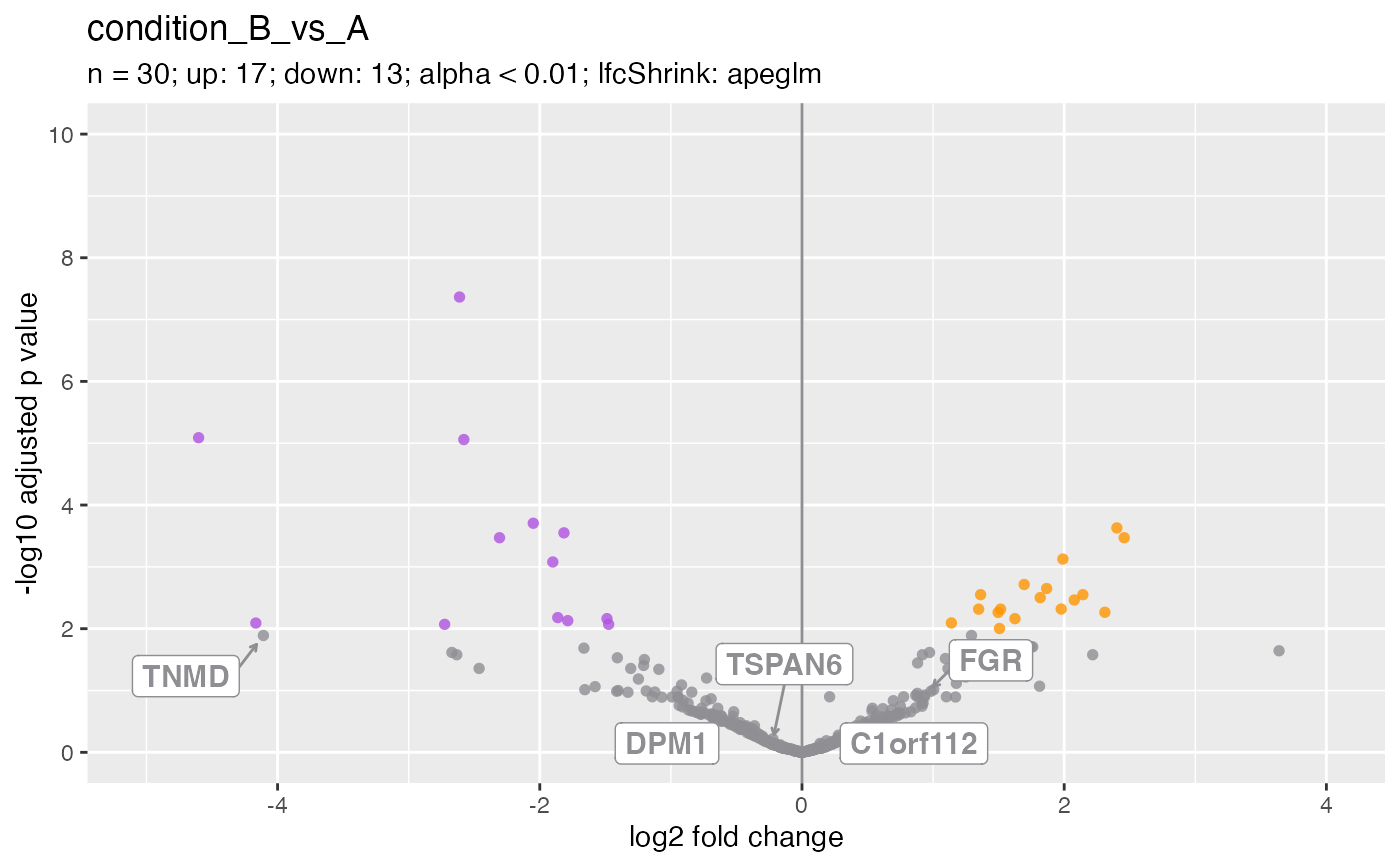
 ## Label genes manually.
## Note that either gene IDs or names (symbols) are supported.
plotVolcano(object, i = 1L, genes = genes)
#> ℹ Labeling 5 genes in plot.
#> ! 1 gene not labeled on plot, due to censored adjusted P value: "SCYL3".
## Label genes manually.
## Note that either gene IDs or names (symbols) are supported.
plotVolcano(object, i = 1L, genes = genes)
#> ℹ Labeling 5 genes in plot.
#> ! 1 gene not labeled on plot, due to censored adjusted P value: "SCYL3".