Heatmap
Usage
plotCorrelationHeatmap(object, ...)

plotHeatmap(object, ...)

plotQuantileHeatmap(object, ...)

# S4 method for class 'DESeqAnalysis'
plotHeatmap(object, ...)

# S4 method for class 'DESeqAnalysis'
plotCorrelationHeatmap(object, ...)

# S4 method for class 'DESeqAnalysis'
plotQuantileHeatmap(object, ...)Scaling
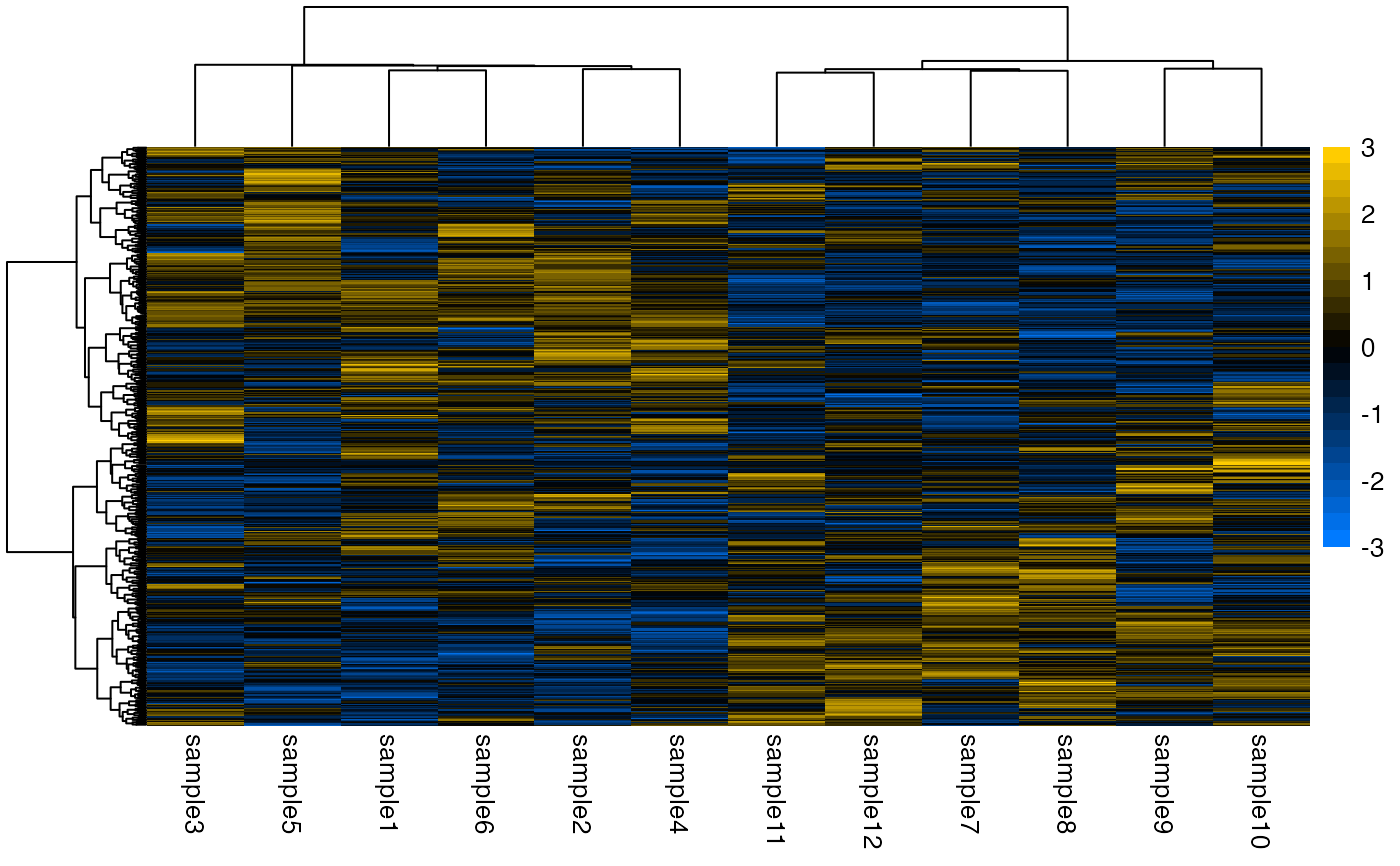
Here we're scaling simply by calculating the standard score (z-score).
mu: mean.
sigma: standard deviation.
x: raw score (e.g. count matrix).
z: standard score (z-score).
See also:
pheatmap:::scale_rows().scale()for additional scaling approaches.
Hierarchical clustering
Row- and column-wise hierarchical clustering is performed when clusterRows
and/or clusterCols are set to TRUE. Internally, this calls hclust(),
and defaults to the Ward method.
Automatic hierarchical clustering of rows and/or columns can error for some datasets. When this occurs, you'll likely see this error:
In this case, either set clusterRows and/or clusterCols to FALSE, or
you can attempt to pass an hclust object to these arguments. This is
recommended as an alternate approach to be used with pheatmap(), which is
called internally by our plotting code. Here's how this can be accomplished:
Examples
data(deseq)

## DESeqAnalysis ====
plotHeatmap(deseq)
#> ℹ Using `DESeqTransform` `varianceStabilizingTransformation` counts.
#> → Scaling matrix per row (z-score).
#> ℹ 1 row doesn't have enough variance: "gene316".
#> → Performing hierarchical clustering with `hclust()` method "ward.D2".

plotCorrelationHeatmap(deseq)
#> ℹ Using `DESeqTransform` `varianceStabilizingTransformation` counts.
#> → Calculating correlation matrix using `pearson` method.

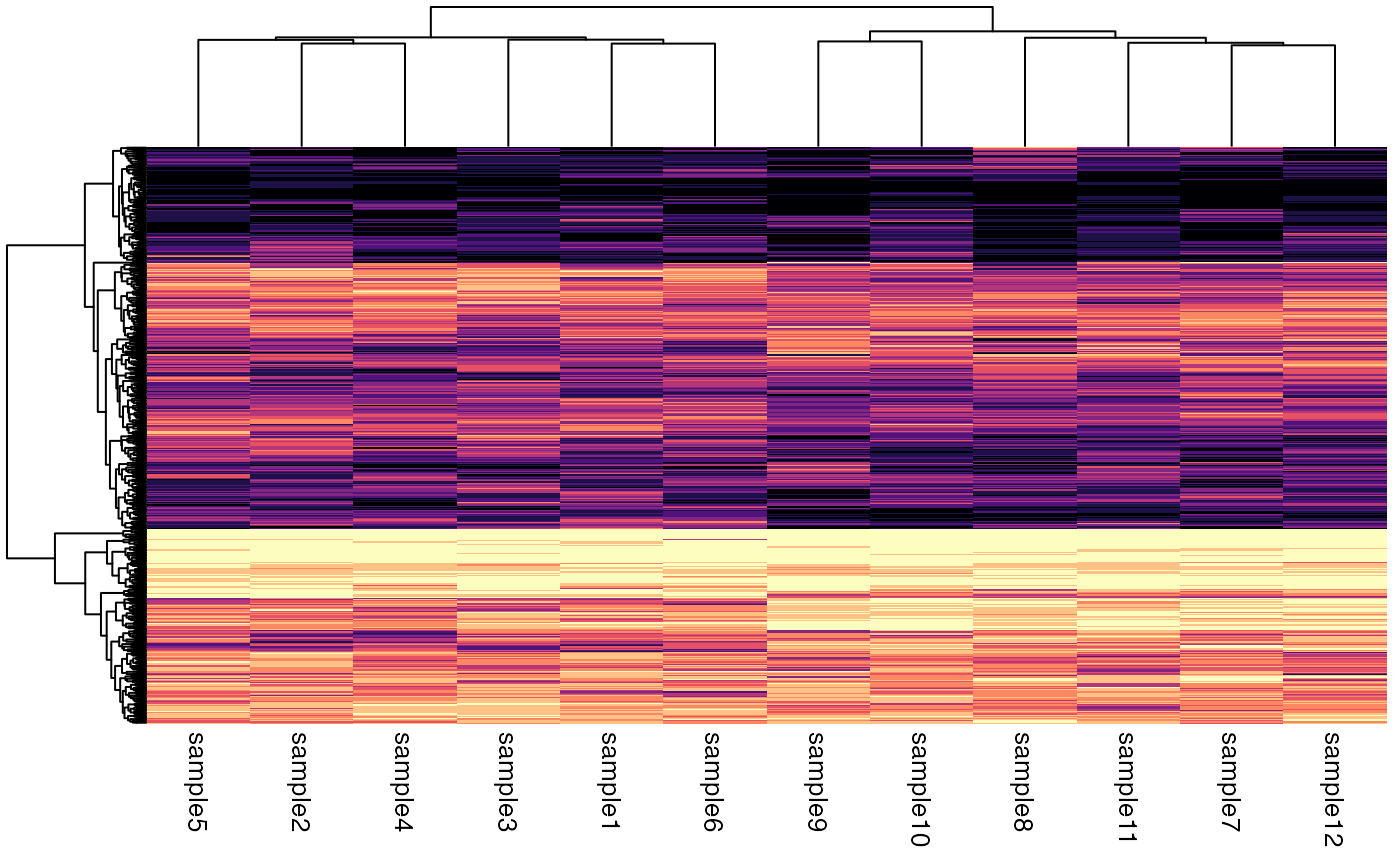
plotQuantileHeatmap(deseq)
#> ℹ Using `DESeqTransform` `varianceStabilizingTransformation` counts.
