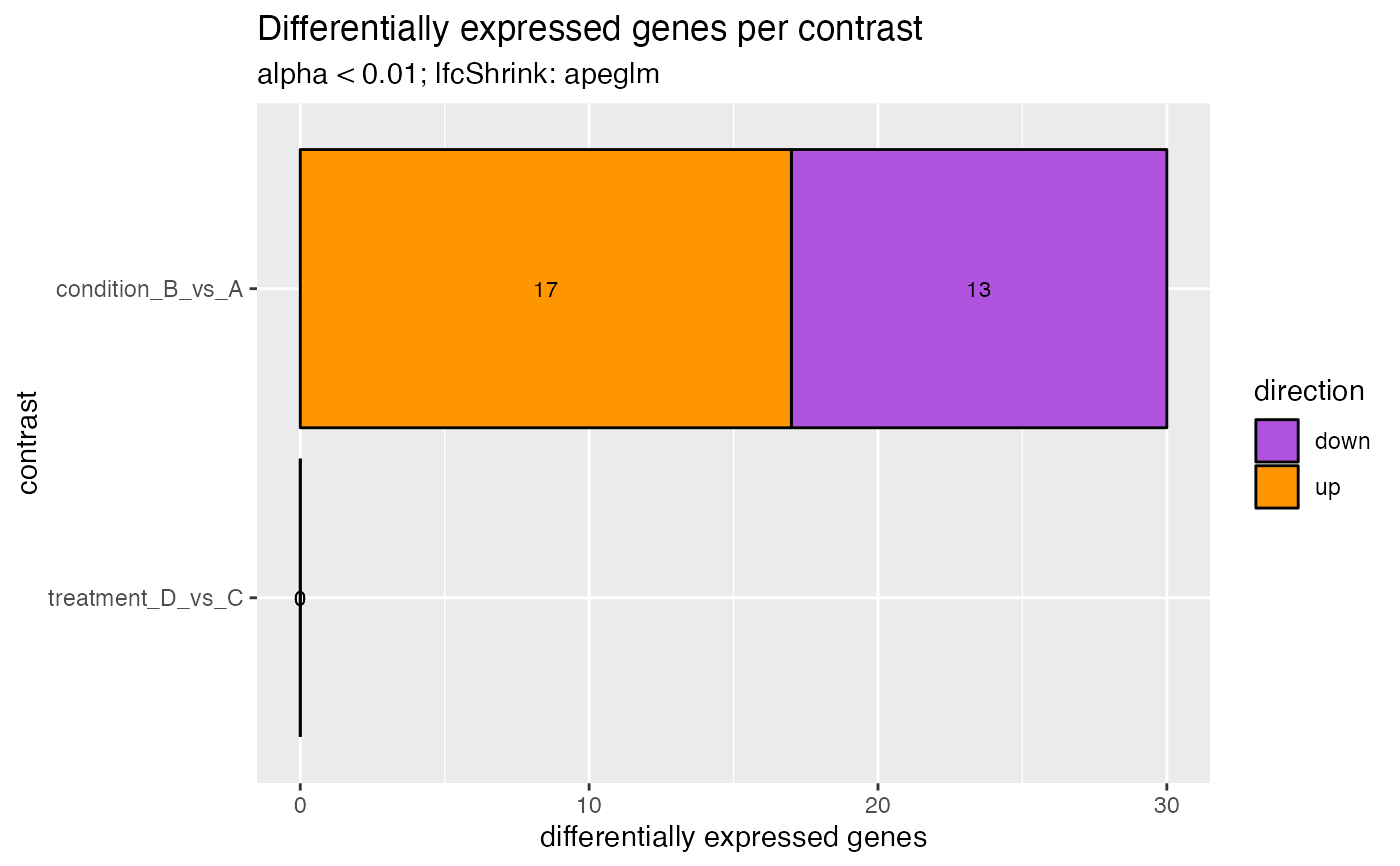
Stacked bar plot of DEGs
Source:R/AllGenerics.R, R/plotDegStackedBar-methods.R
plotDegStackedBar.RdStacked bar plot of DEGs
Usage
plotDegStackedBar(object, ...)

# S4 method for class 'DESeqAnalysis'
plotDegStackedBar(
  object,
  i = NULL,
  direction = c("both", "up", "down"),
  orderBySize = FALSE,
  label = TRUE,
  flip = TRUE
)
Arguments
- object
Object.
- i
character,numeric, orNULL. Names or range of results. If setNULL, include all results.- direction
character(1). Include"both","up", or"down"directions.- orderBySize
logical(1). Order contrasts by DEG set size.- label
logical(1). Label the number of DEGs per contrast on the plot.- flip
logical(1). Flip x and y axes. Recommended for plots containing many samples.- ...
Additional arguments.
Examples
data(deseq)

## DESeqAnalysis ====
plotDegStackedBar(deseq)