Plot differentially expressed gene principal component analysis
Source:R/AllGenerics.R, R/plotDegPca-methods.R
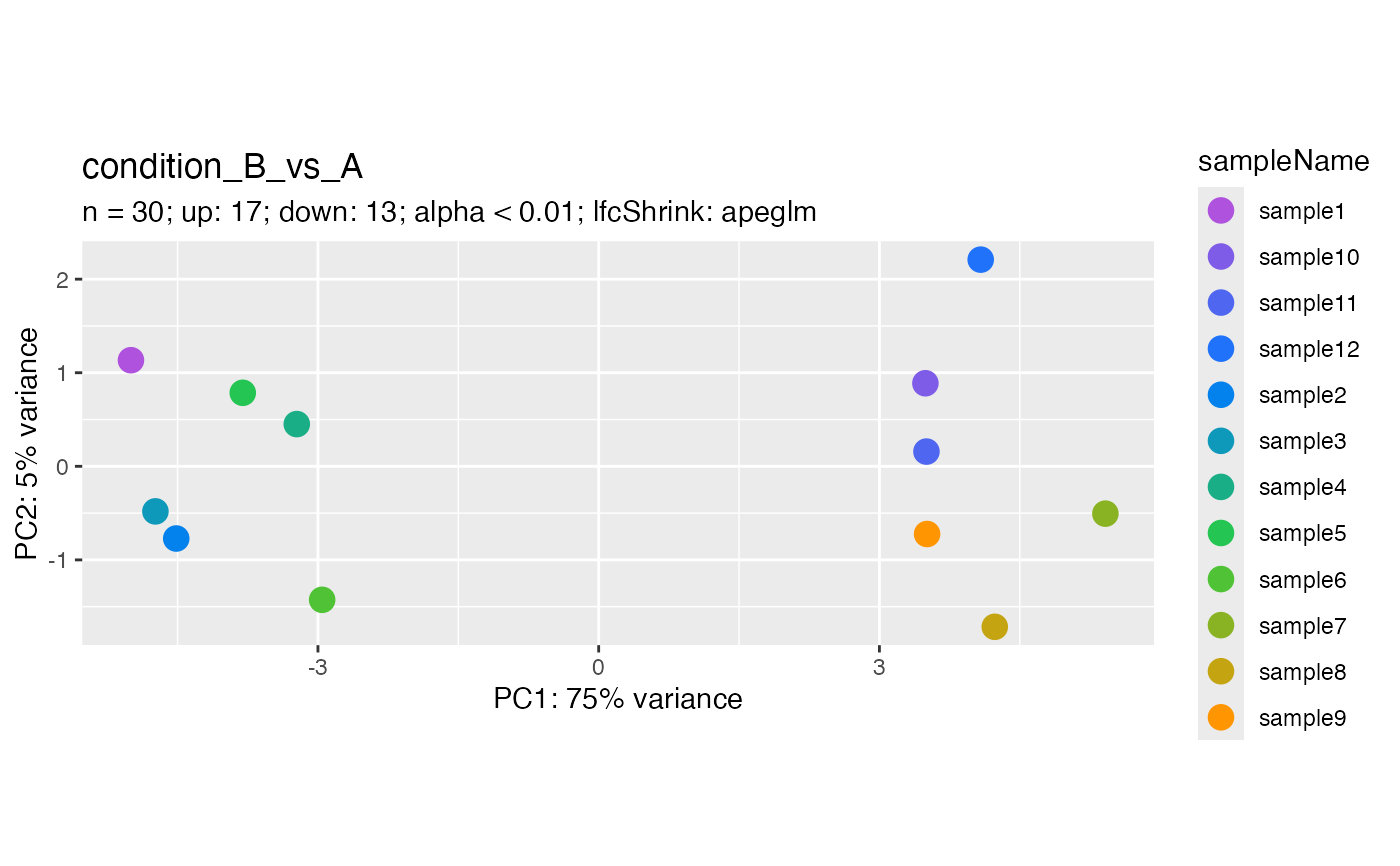
plotDegPca.RdThis function is an extension of plotPCA() that is optimized for automatic
handling of differentially expressed genes, rather than requiring manual
input of a gene vector or subset object.
Usage
plotDegPca(object, ...)

# S4 method for class 'DESeqAnalysis'
plotDegPca(
  object,
  i,
  contrastSamples = FALSE,
  alphaThreshold = NULL,
  baseMeanThreshold = NULL,
  lfcThreshold = NULL,
  ...
)

# S4 method for class 'DESeqResults'
plotDegPca(
  object,
  DESeqTransform,
  direction = c("both", "up", "down"),
  alphaThreshold = NULL,
  baseMeanThreshold = NULL,
  lfcThreshold = NULL,
  ...
)
Arguments
- object
Object.
- i
Indices specifying elements to extract or replace. Indices are
numericorcharactervectors, empty (missing), orNULL.For more information:
- contrastSamples
logical(1). Only include the samples used to define the contrast passed toDESeq2::results(). This setting will break for complex DESeq2 contrasts (e.g. interaction effect).- alphaThreshold
numeric(1)orNULL. Adjusted P value ("alpha") cutoff. If leftNULL, will use the cutoff defined in the object.- baseMeanThreshold
numeric(1)orNULL. Base mean (i.e. average expression across all samples) threshold. If leftNULL, will use the cutoff defined in the object. Applies in general to DESeq2 RNA-seq differential expression output.- lfcThreshold
numeric(1)orNULL. Log (base 2) fold change ratio cutoff threshold. If leftNULL, will use the cutoff defined in the object.- ...
Additional arguments.
- DESeqTransform
DESeqTransform.- direction
character(1). Include"both","up", or"down"directions.
Details
To adjust the annotation columns, modify the colData() of the counts
argument, which must contain/extend a SummarizedExperiment.
Examples
data(deseq)

## DESeqAnalysis ====
plotDegPca(deseq, i = 1L)