Plot counts
Usage
plotCounts(object, ...)

# S4 method for class 'DESeqAnalysis'
plotCounts(object, ..., samples = NULL, transform = FALSE)

# S4 method for class 'DESeqDataSet'
plotCounts(object, ...)

# S4 method for class 'DESeqTransform'
plotCounts(object, ...)Value
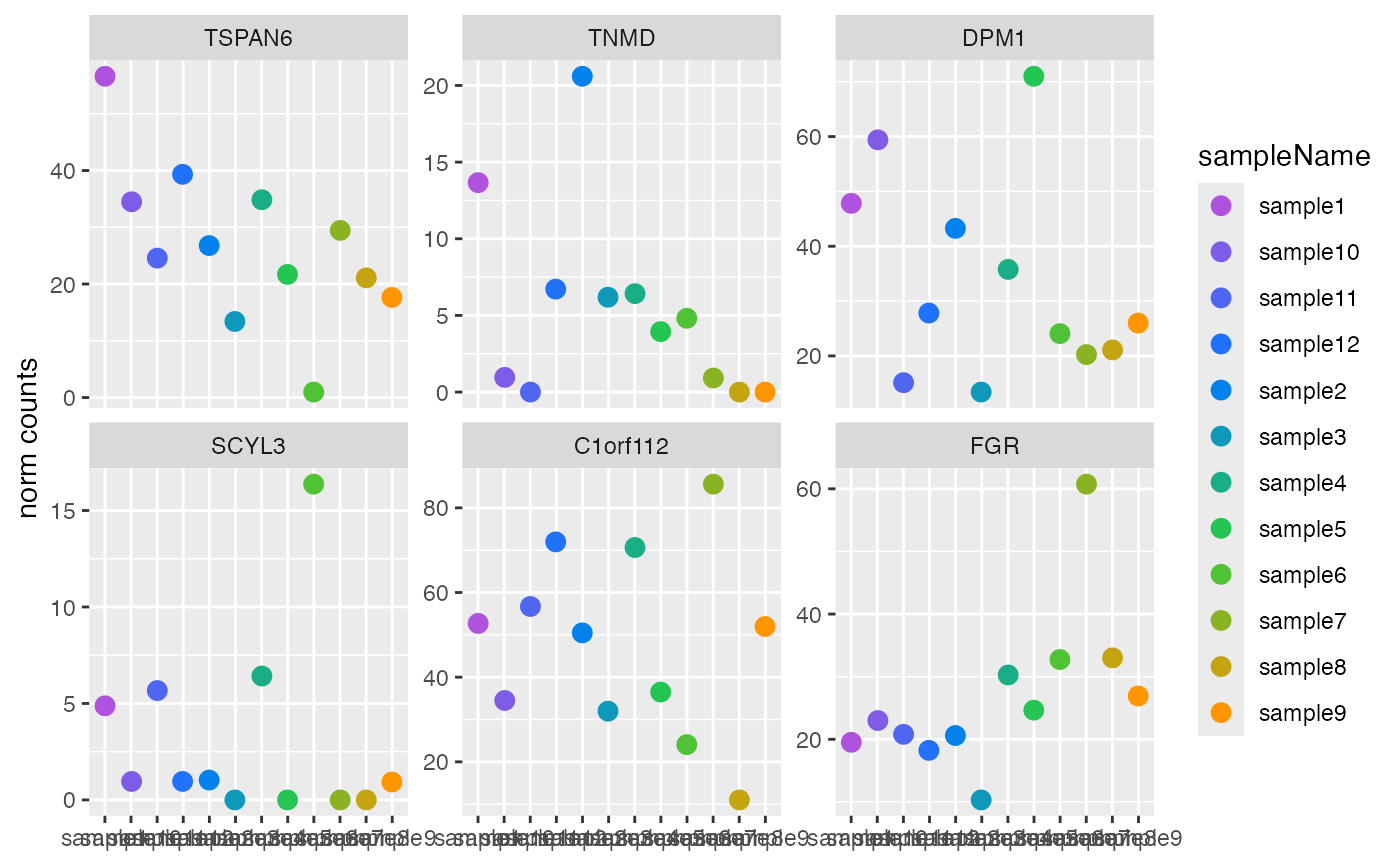
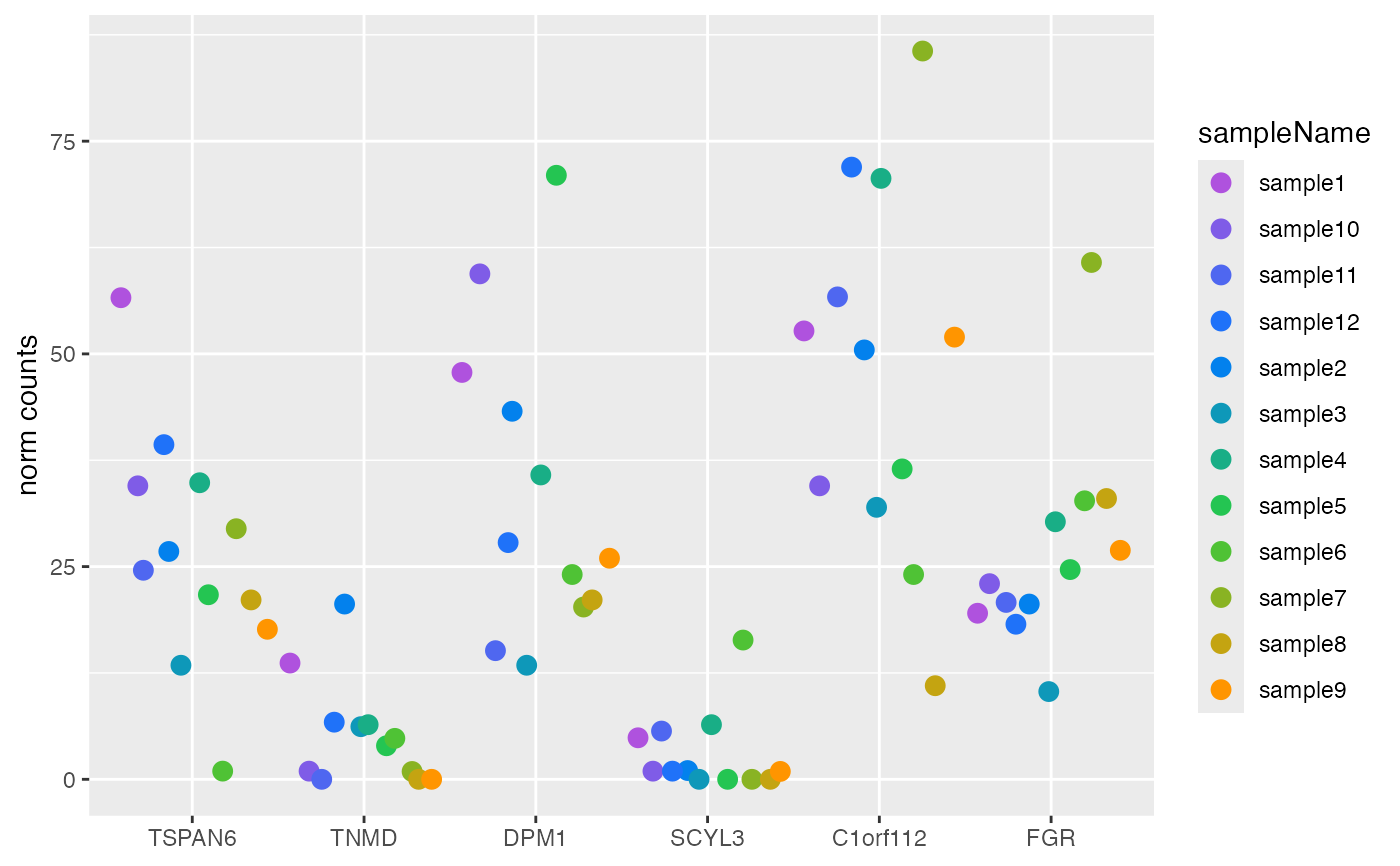
style = "facet":ggplotgrouped bysampleName, withggplot2::facet_wrap()applied to panel the samples.style = "wide":ggplotin wide format, with genes on the x-axis.
Functions
plotCounts(DESeqAnalysis): Plot eitherDESeqDataSetnormalized counts orDESeqTransformlog2 variance-stabilized counts.plotCounts(DESeqDataSet): Plot size factor (i.e. library size) adjusted normalized counts. Arguments pass through toSummarizedExperimentmethod defined in AcidPlots package.plotCounts(DESeqTransform): Plot log2 variance-stabilized transformed counts.