Plot scatterplot of differential expression contrast
Source:R/AllGenerics.R, R/plotContrastScatter-methods.R
plotContrastScatter.RdPlot scatterplot of differential expression contrast
Usage
plotContrastScatter(object, ...)

# S4 method for class 'DESeqAnalysis'
plotContrastScatter(
  object,
  i,
  direction = c("both", "up", "down"),
  alphaThreshold = NULL,
  baseMeanThreshold = NULL,
  lfcThreshold = NULL,
  pointColor = c(downregulated = AcidPlots::lightPalette[["purple"]], upregulated =
    AcidPlots::lightPalette[["orange"]], nonsignificant =
    AcidPlots::lightPalette[["gray"]]),
  pointSize = 2L,
  pointAlpha = 0.8,
  trans = c("log2", "log10", "identity"),
  limits = list(x = NULL, y = NULL),
  labels = list(title = TRUE, subtitle = NULL, x = TRUE, y = TRUE)
)
Arguments
- object
Object.
- i
Indices specifying elements to extract or replace. Indices are
numericorcharactervectors, empty (missing), orNULL.For more information:
- direction
character(1). Include"both","up", or"down"directions.- alphaThreshold
numeric(1)orNULL. Adjusted P value ("alpha") cutoff. If leftNULL, will use the cutoff defined in the object.- baseMeanThreshold
numeric(1)orNULL. Base mean (i.e. average expression across all samples) threshold. If leftNULL, will use the cutoff defined in the object. Applies in general to DESeq2 RNA-seq differential expression output.- lfcThreshold
numeric(1)orNULL. Log (base 2) fold change ratio cutoff threshold. If leftNULL, will use the cutoff defined in the object.- pointColor
character(1). Default point color for the plot.- pointSize
numeric(1). Point size for dots in the plot. In the range of 1-3 is generally recommended.- pointAlpha
numeric(1)(0-1). Alpha transparency level.- trans
character(1). Name of the axis scale transformation to apply.For more information:
- limits
list(2). Named list containing"x"and"y"that define the lower and upper limits for each axis. Set automatically by default when leftNULL.- labels
list. ggplot2 labels. Seeggplot2::labs()for details.- ...
Additional arguments.
Examples
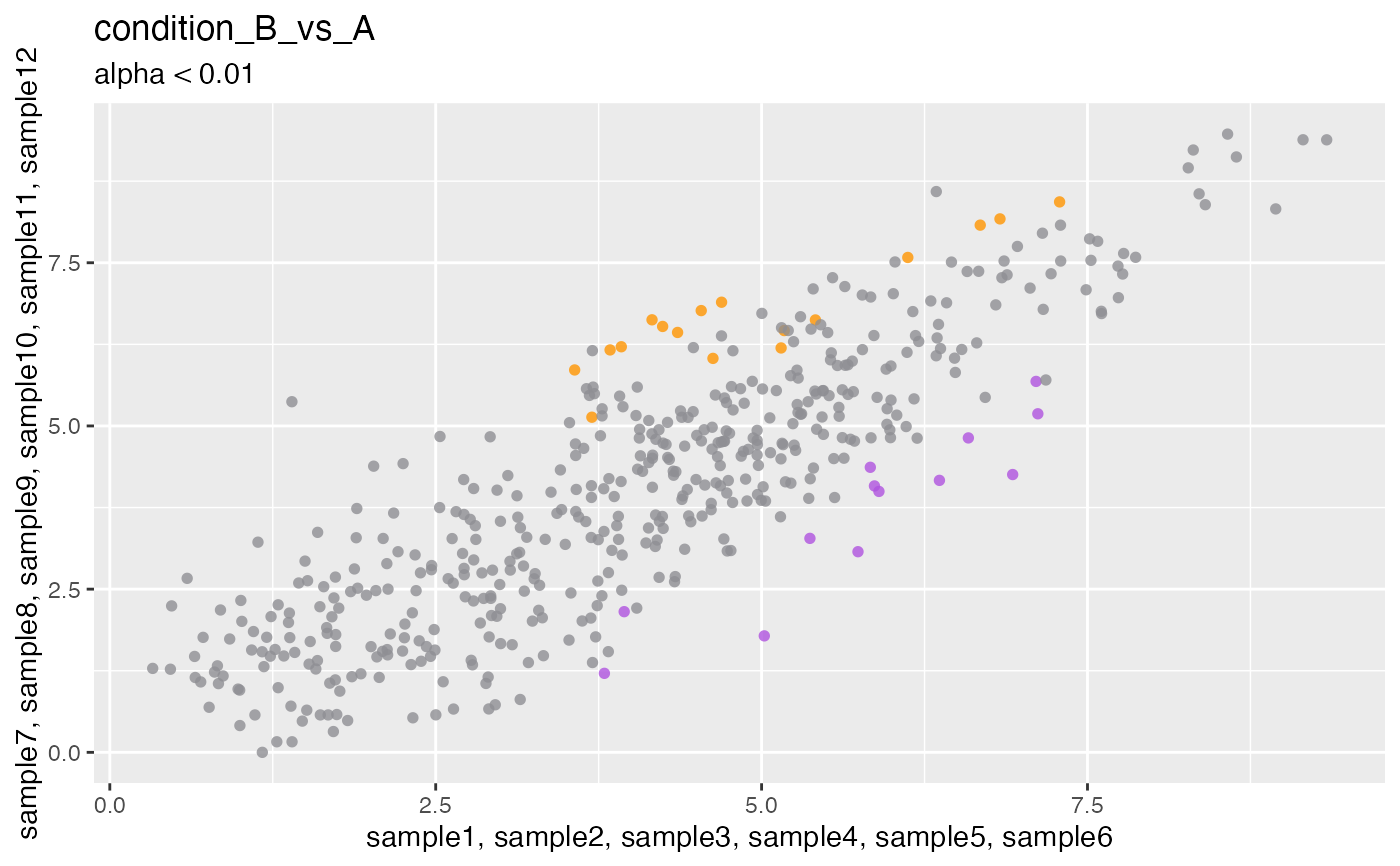
data(deseq)

## DESeqAnalysis ====
plotContrastScatter(deseq, i = 1L)
#> Contrast: condition_B_vs_A
#> Factor column: condition
#> Numerator samples: "sample7", "sample8", "sample9", "sample10", "sample11"...
#> Denominator samples: "sample1", "sample2", "sample3", "sample4", "sample5"...