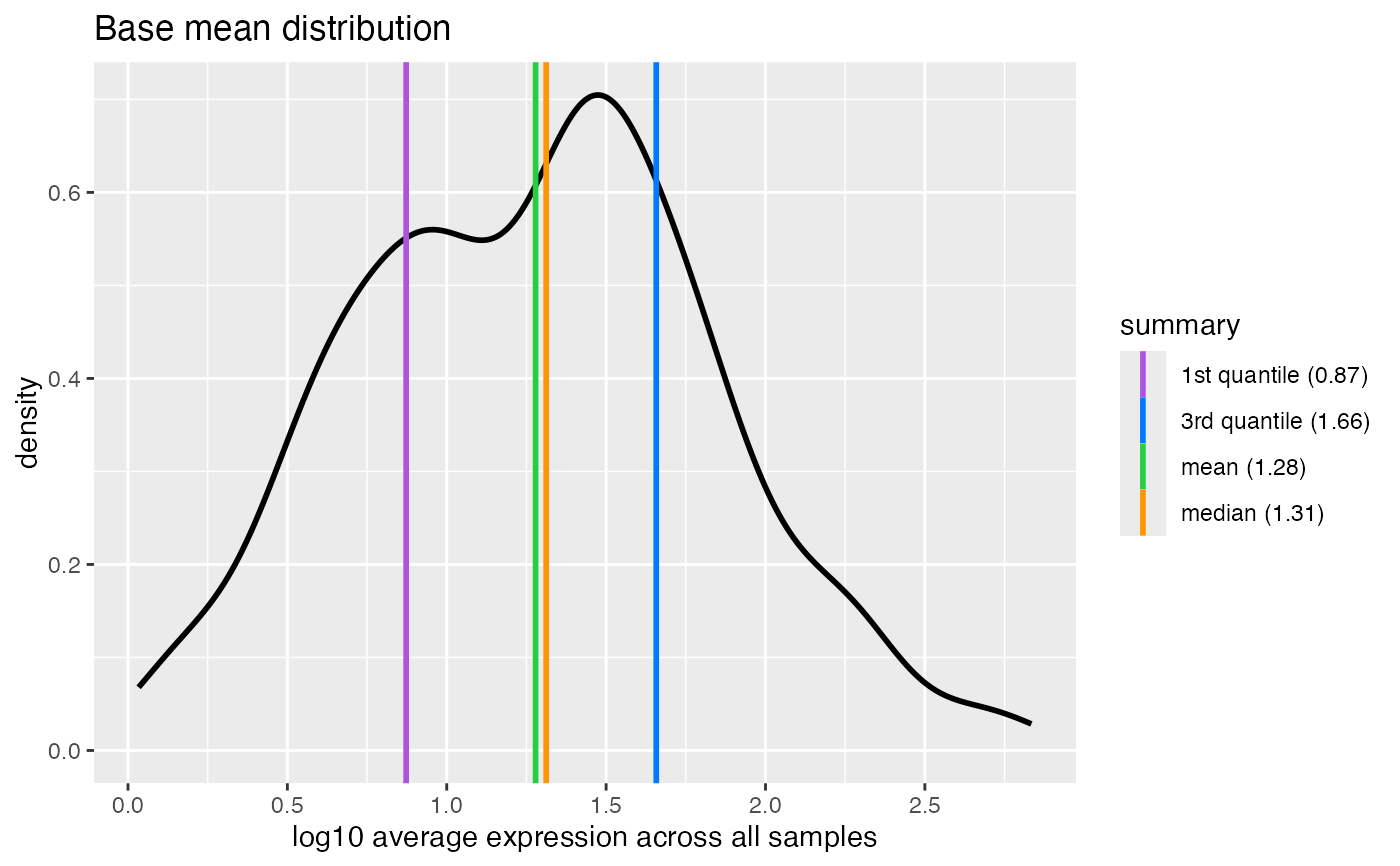
The base mean is the mean of normalized counts of all samples, normalizing for sequencing depth.
Usage
plotBaseMean(object, ...)

# S4 method for class 'DESeqAnalysis'
plotBaseMean(
  object,
  nonzero = TRUE,
  trans = c("log10", "log2", "identity"),
  summary = TRUE,
  labels = list(title = "Base mean distribution", subtitle = NULL)
)

# S4 method for class 'DESeqDataSet'
plotBaseMean(
  object,
  nonzero = TRUE,
  trans = c("log10", "log2", "identity"),
  summary = TRUE,
  labels = list(title = "Base mean distribution", subtitle = NULL)
)

# S4 method for class 'DESeqResults'
plotBaseMean(
  object,
  nonzero = TRUE,
  trans = c("log10", "log2", "identity"),
  summary = TRUE,
  labels = list(title = "Base mean distribution", subtitle = NULL)
)
Arguments
- object
Object.
- nonzero
logical(1). Remove zero-count features (genes).- trans
character(1). Name of the axis scale transformation to apply.For more information:
- summary
logical(1). Include distribution summary statistics as lines on the plot.- labels
list. ggplot2 labels. Seeggplot2::labs()for details.- ...
Additional arguments.
Functions
plotBaseMean(DESeqAnalysis): Passes toDESeqDataSetmethod.plotBaseMean(DESeqDataSet): Generates row means of normalized counts. This value corresponds to thebaseMeancolumn ofDESeqResults.plotBaseMean(DESeqResults): UsesbaseMeancolumn of results.
Examples
data(deseq)

## DESeqAnalysis ====
plotBaseMean(deseq)
#> ℹ Removing 1 zero-count feature.
#> ℹ Summary prior to transformation:
#> Min. 1st Qu.  Median    Mean 3rd Qu.    Max.
#> 0.08    6.46   19.51   42.53   44.43  681.66
#> → Applying 'log10(x + 1)' transformation.
#> ℹ Summary after transformation:
#> Min. 1st Qu.  Median    Mean 3rd Qu.    Max.
#> 0.03    0.87    1.31    1.28    1.66    2.83