Usage
markdownPlots(object, ...)

# S4 method for class 'list'
markdownPlots(object, headerLevel = 2L)
Arguments
- object
Object.
integer(1) (1-7).
Markdown header level.
- ...
Additional arguments.
Value
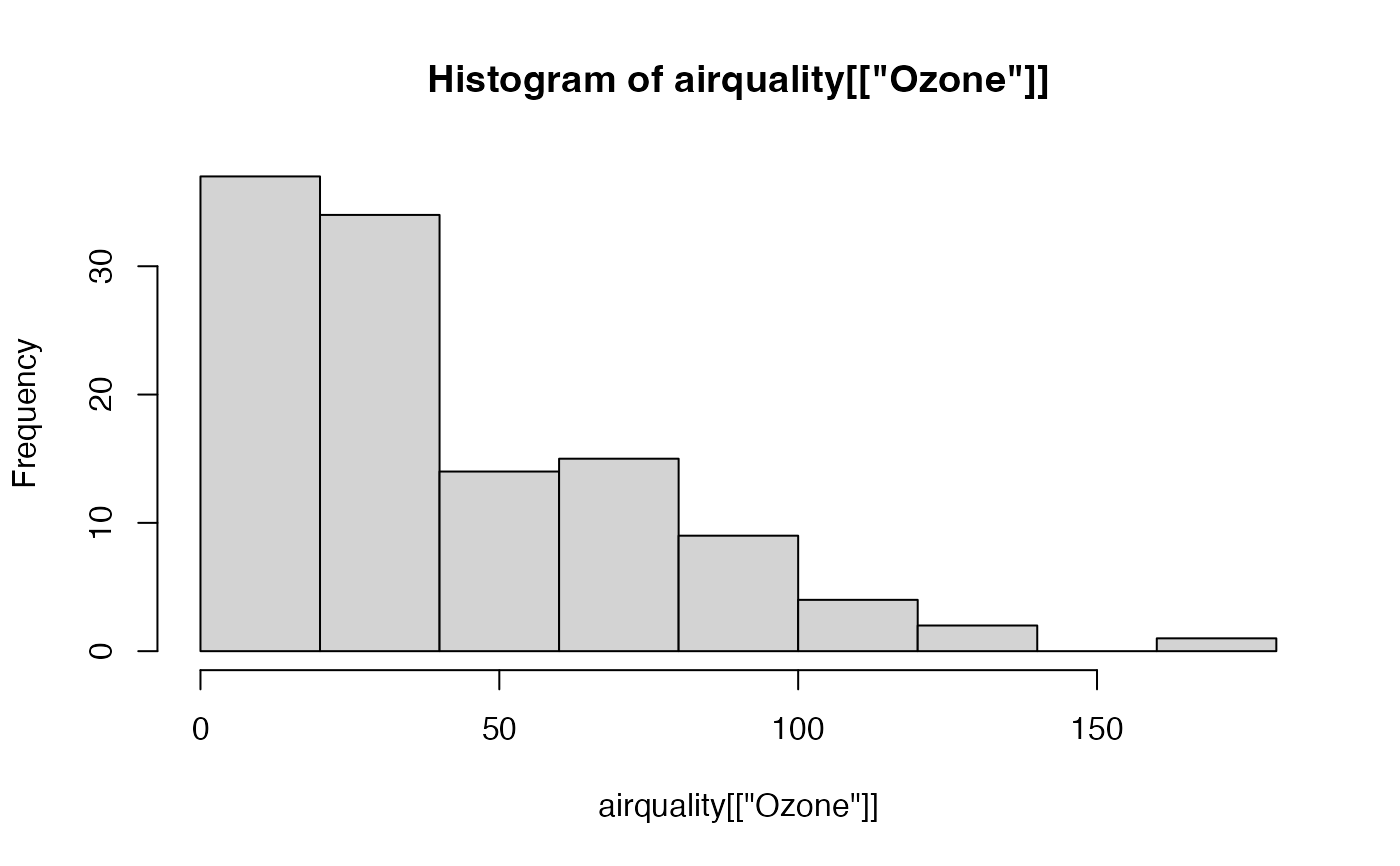
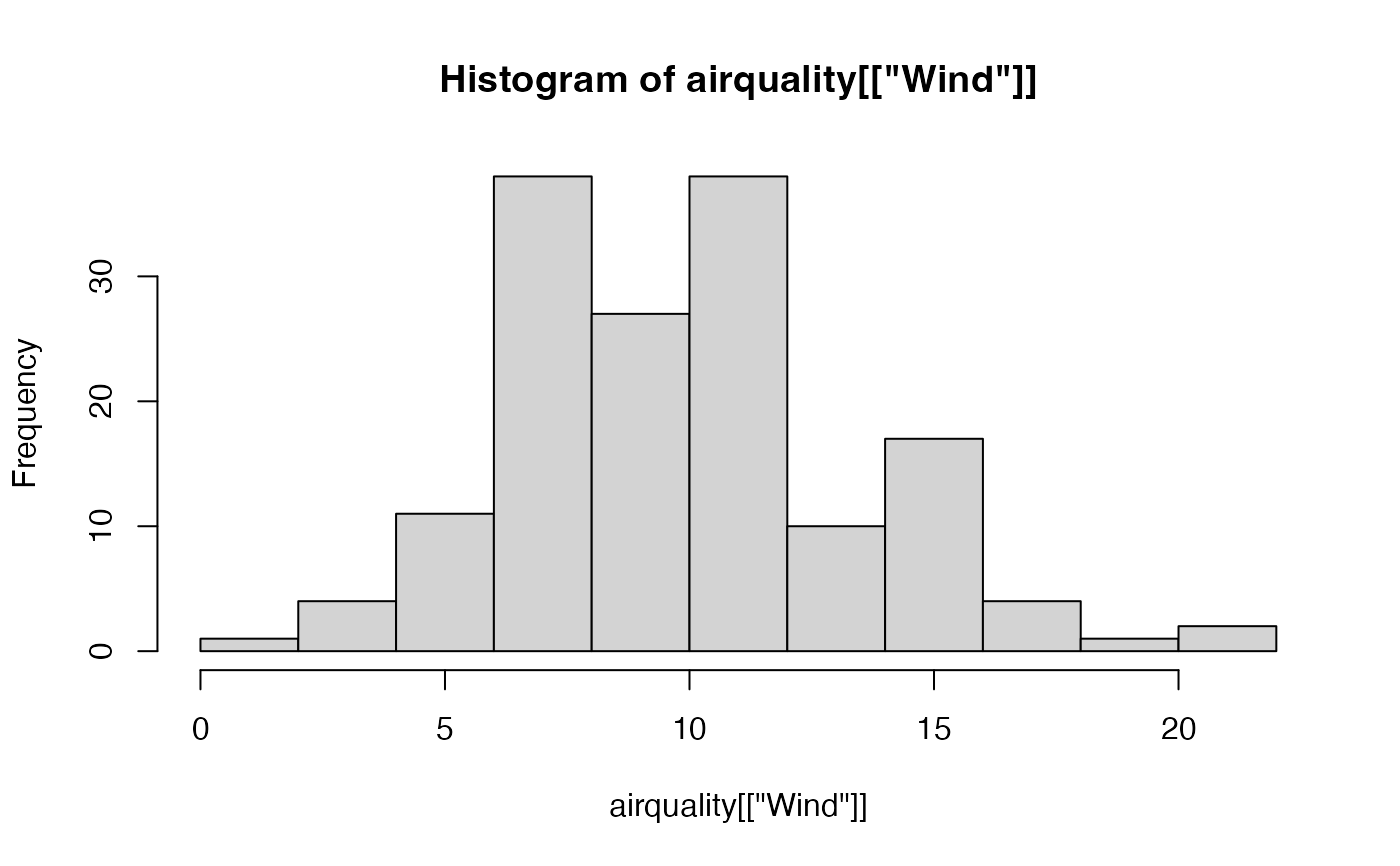
Graphical output of plots.
Separated by Markdown headers.
Details
Supports using a named list containing multiple ggplot objects, which
can be used in an R Markdown report, separated by headers. Internally, the
headers are generated with the markdownHeader function.
See also
Examples taken from:
https://bookdown.org/rdpeng/exdata/the-base-plotting-system-1.html
Examples
## Base R plotting example.
data(airquality, package = "datasets")
p1 <- hist(airquality[["Ozone"]], plot = FALSE)
p2 <- hist(airquality[["Wind"]], plot = FALSE)
list <- list("ozone" = p1, "wind" = p2)
markdownPlots(list)
#>
#>
#> ## ozone
#>

#>
#>
#> ## wind
#>
#>
#>
#> ## wind
#>
