Quality control
Usage
plotQc(object, ...)

# S4 method for class 'SingleCellExperiment'
plotQc(
  object,
  geom = c("histogram", "ecdf", "violin", "ridgeline", "boxplot"),
  legend = getOption(x = "acid.legend", default = TRUE),
  assay = 1L,
  interestingGroups = NULL,
  labels = list(title = "Quality control", subtitle = NULL)
)

# S4 method for class 'SummarizedExperiment'
plotQc(
  object,
  legend = getOption(x = "acid.legend", default = TRUE),
  assay = 1L,
  interestingGroups = NULL,
  labels = list(title = "Quality control", subtitle = NULL)
)
Arguments
- object
Object.
- geom
character(1). Plot type. Usesmatch.arg()internally and defaults to the first argument in thecharactervector.- legend
logical(1). Include plot legend.- assay
vector(1). Assay name or index position.- interestingGroups
character. Groups of interest to use for visualization. Corresponds to factors describing the columns of the object.- labels
list. ggplot2 labels. Seeggplot2::labs()for details.- ...
Additional arguments.
Examples
data(
RangedSummarizedExperiment,
SingleCellExperiment_splatter,
package = "AcidTest"
)
## SummarizedExperiment ====
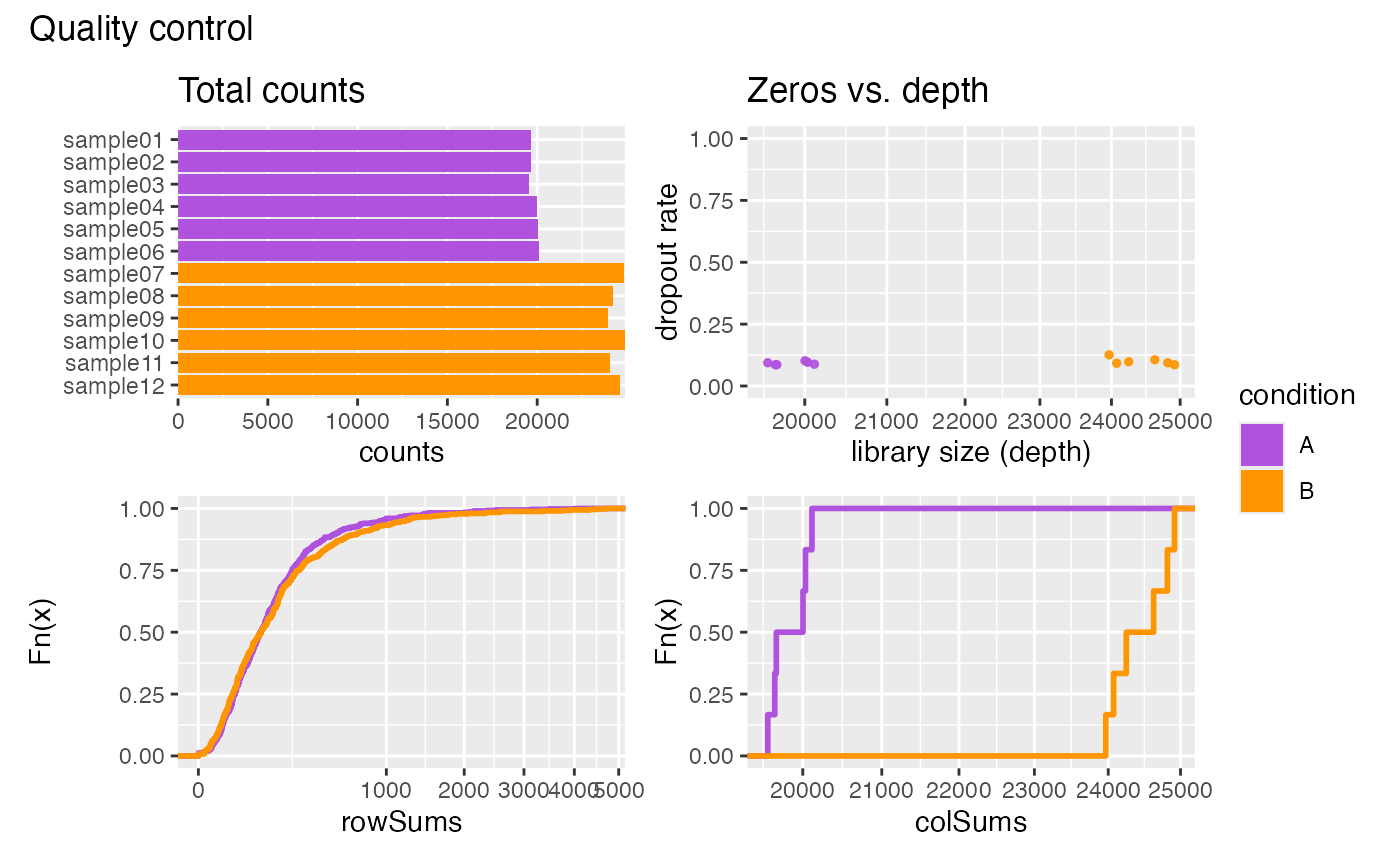
object <- RangedSummarizedExperiment
plotQc(object)
 ## SingleCellExperiment ====
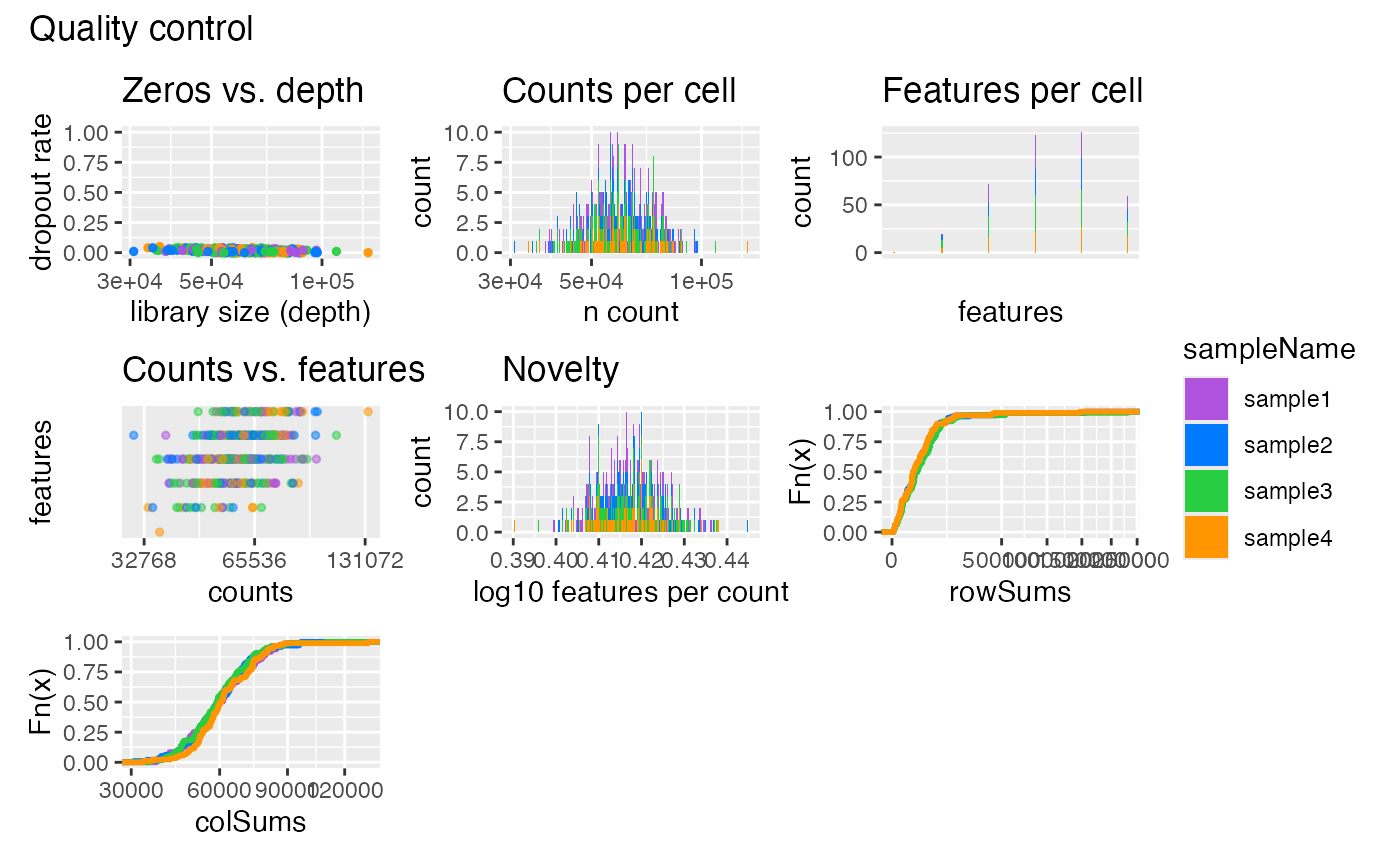
object <- SingleCellExperiment_splatter
plotQc(object)
#> Ignoring unknown labels:
#> • colour : "sampleName"
#> Ignoring unknown labels:
#> • colour : "sampleName"
#> Ignoring unknown labels:
#> • colour : "sampleName"
## SingleCellExperiment ====
object <- SingleCellExperiment_splatter
plotQc(object)
#> Ignoring unknown labels:
#> • colour : "sampleName"
#> Ignoring unknown labels:
#> • colour : "sampleName"
#> Ignoring unknown labels:
#> • colour : "sampleName"